Biotech Companies by Disease: $672B Across 299 Indications, 198 Uncontested
BWBiopharmaWatch Research··14 min read
198 of the 299 diseases on this map have exactly one US-listed biotech developing a drug for them. Not a crowded field, not a race: one company. That is two thirds of the disease space with no peer set, no read-across and nothing to price against. The other 101 are contested, and it is there that the surprising part shows up: the crowded diseases carry the cheapest companies.
We mapped 275 US-listed drug developers capitalised between $100 million and $20 billion, holding $672B of market value, across 299 distinct indications. Every company is placed by the disease it is actually running trials in, and its market value is allocated across those diseases so that every dollar is counted exactly once.
Which biotech companies are developing drugs for each disease?
Every one of the 299 indications on this map carries its own competitor list. For each disease we name every US-listed developer in the $100 million to $20 billion band running an industry-sponsored clinical programme in it, with the drug, the phase, the trial count, the market capitalisation and the next dated catalyst.
That turns a question which normally takes an afternoon into one page. Non-small cell lung cancer has 30 of them. Achondroplasia has 4: BMRN, ASND, BBIO, TYRA. Duchenne muscular dystrophy has 13, MASH has 4.
The point of naming them together is that they move together. A company competing in a disease is exposed to every readout in that disease, not only its own, because a rival's Phase 3 result re-prices the standard of care that everyone else has to beat.
Does more competition make a disease more valuable?
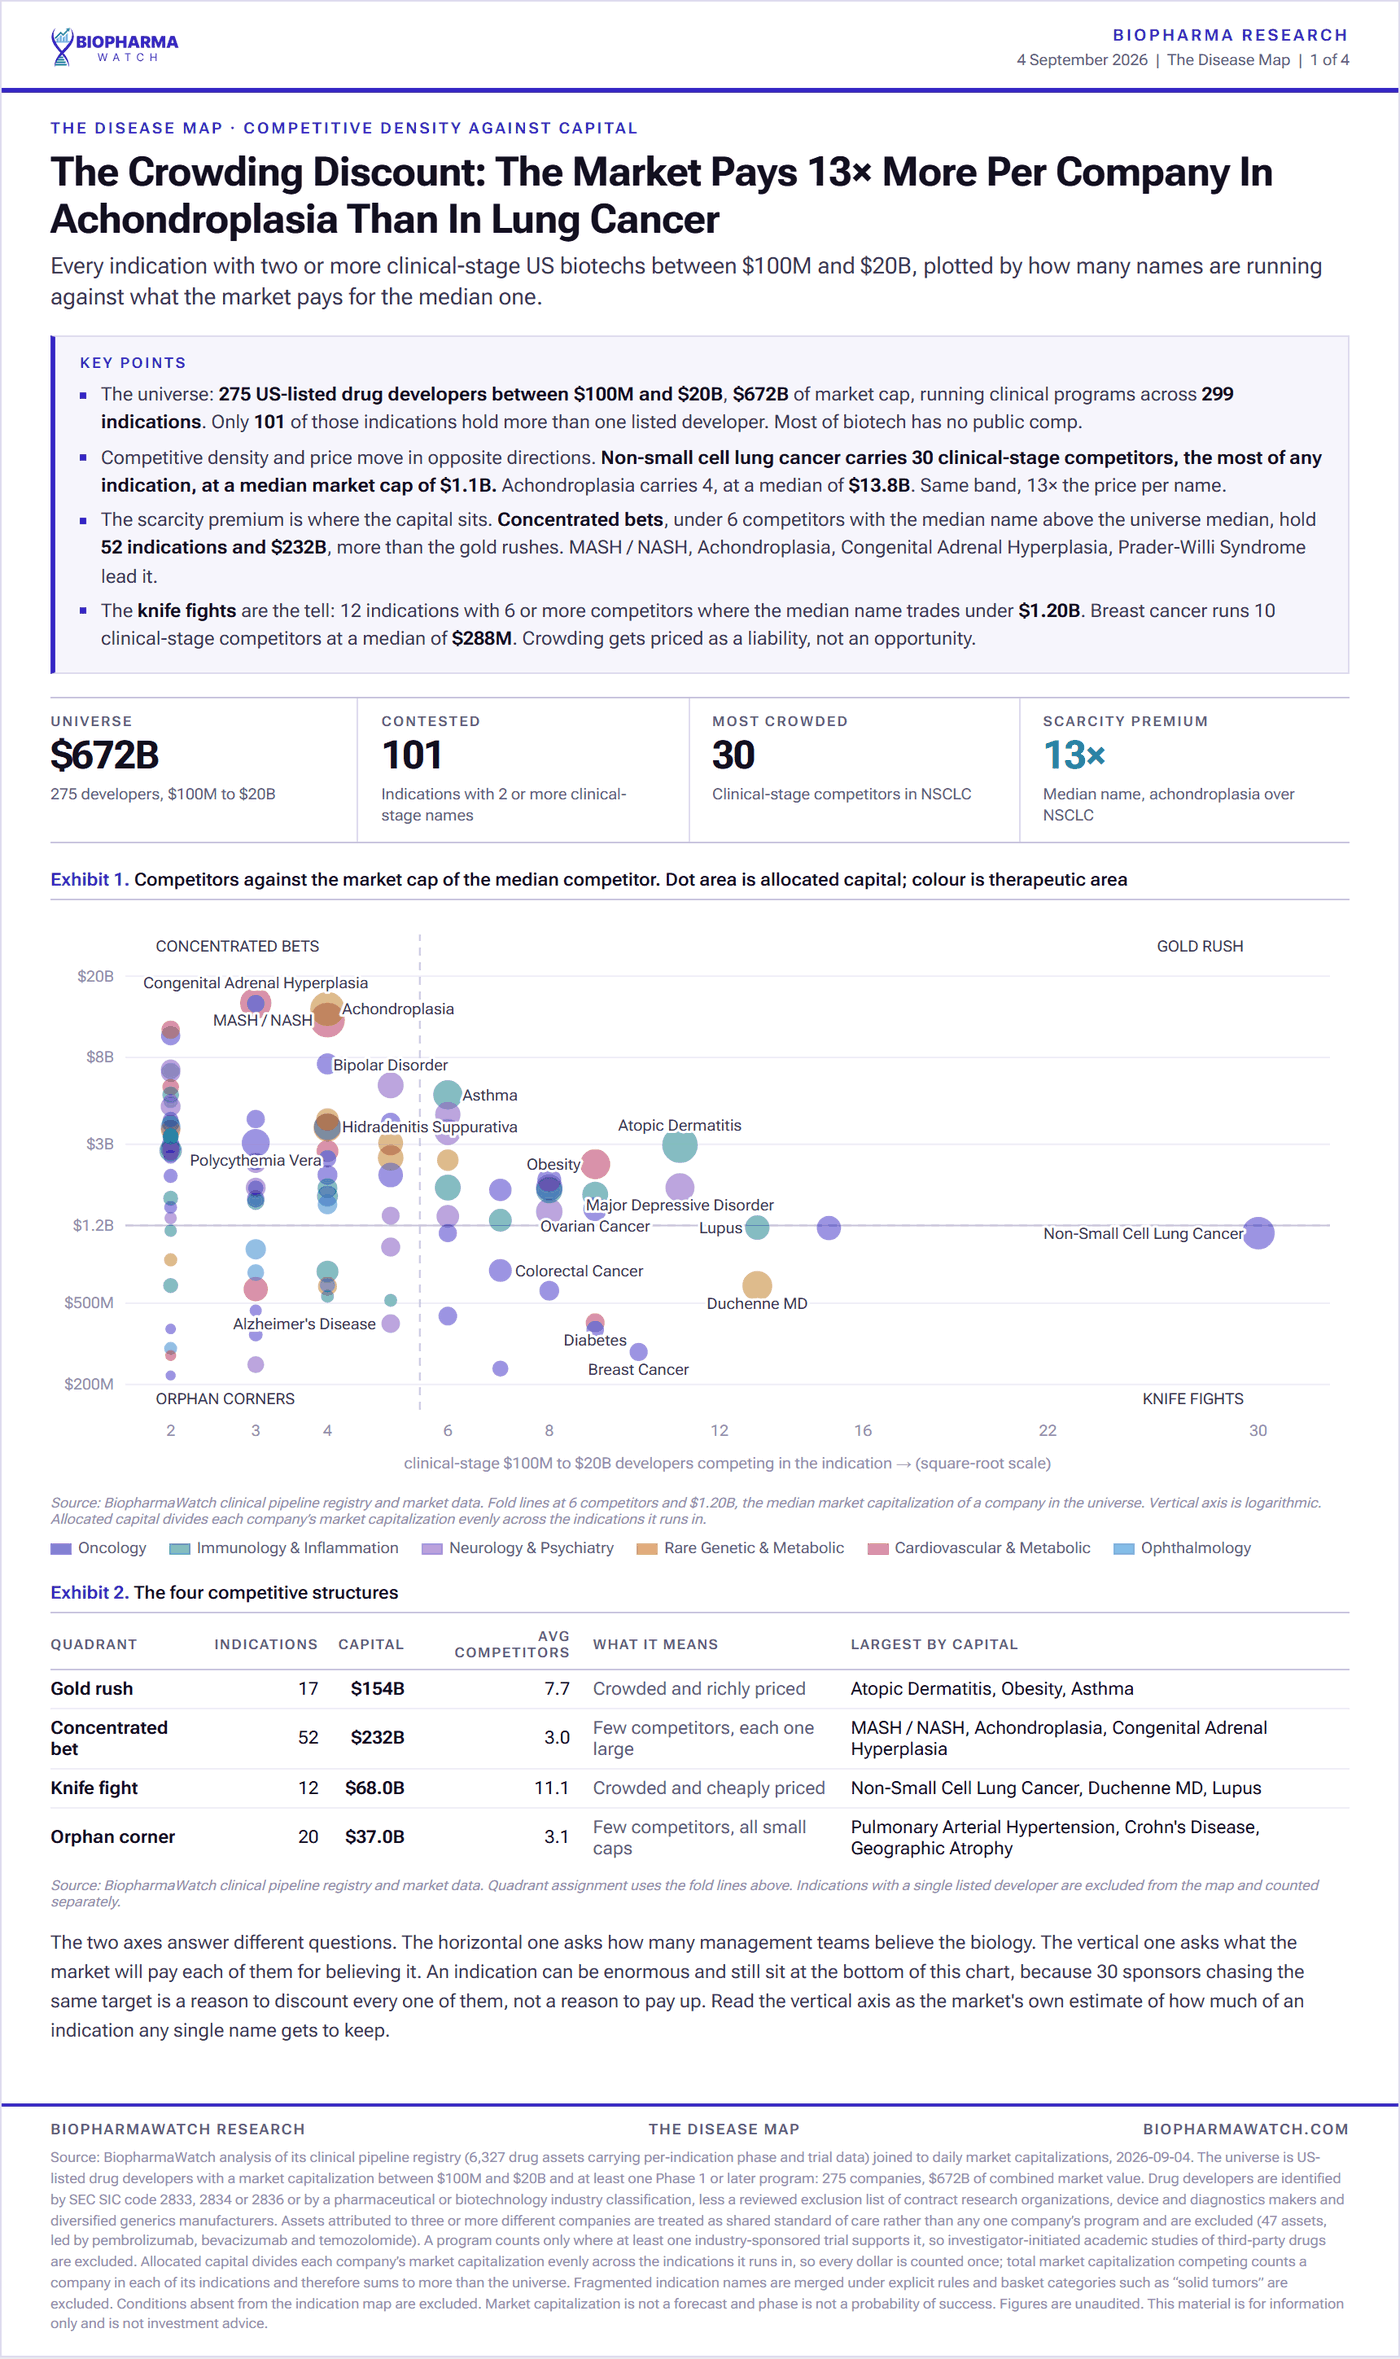
No, and the relationship runs the other way. Indications with two or three competitors carry a median company worth $2.6B. Indications with ten or more carry $1.2B. The market pays for scarcity of credible competitors, not for the size of the disease.
The clearest pair on the map: achondroplasia has 4 competitors and a median company of $13.8B. Non-small cell lung cancer has 30 and a median of $1.1B. That is roughly 12.5 times more per company to compete in a rare bone-growth disorder than in the largest cancer indication in the world.
Three things drive it, and none of them is that lung cancer is a bad business. Entry is cheap in a large indication, so the field fills. The odds of any single entrant winning fall as the field grows. And the biggest winners leave the band entirely once they pass $20 billion, which makes a successful field look thinner from inside this universe than it feels from outside it.
Which diseases have the most biotech competitors?
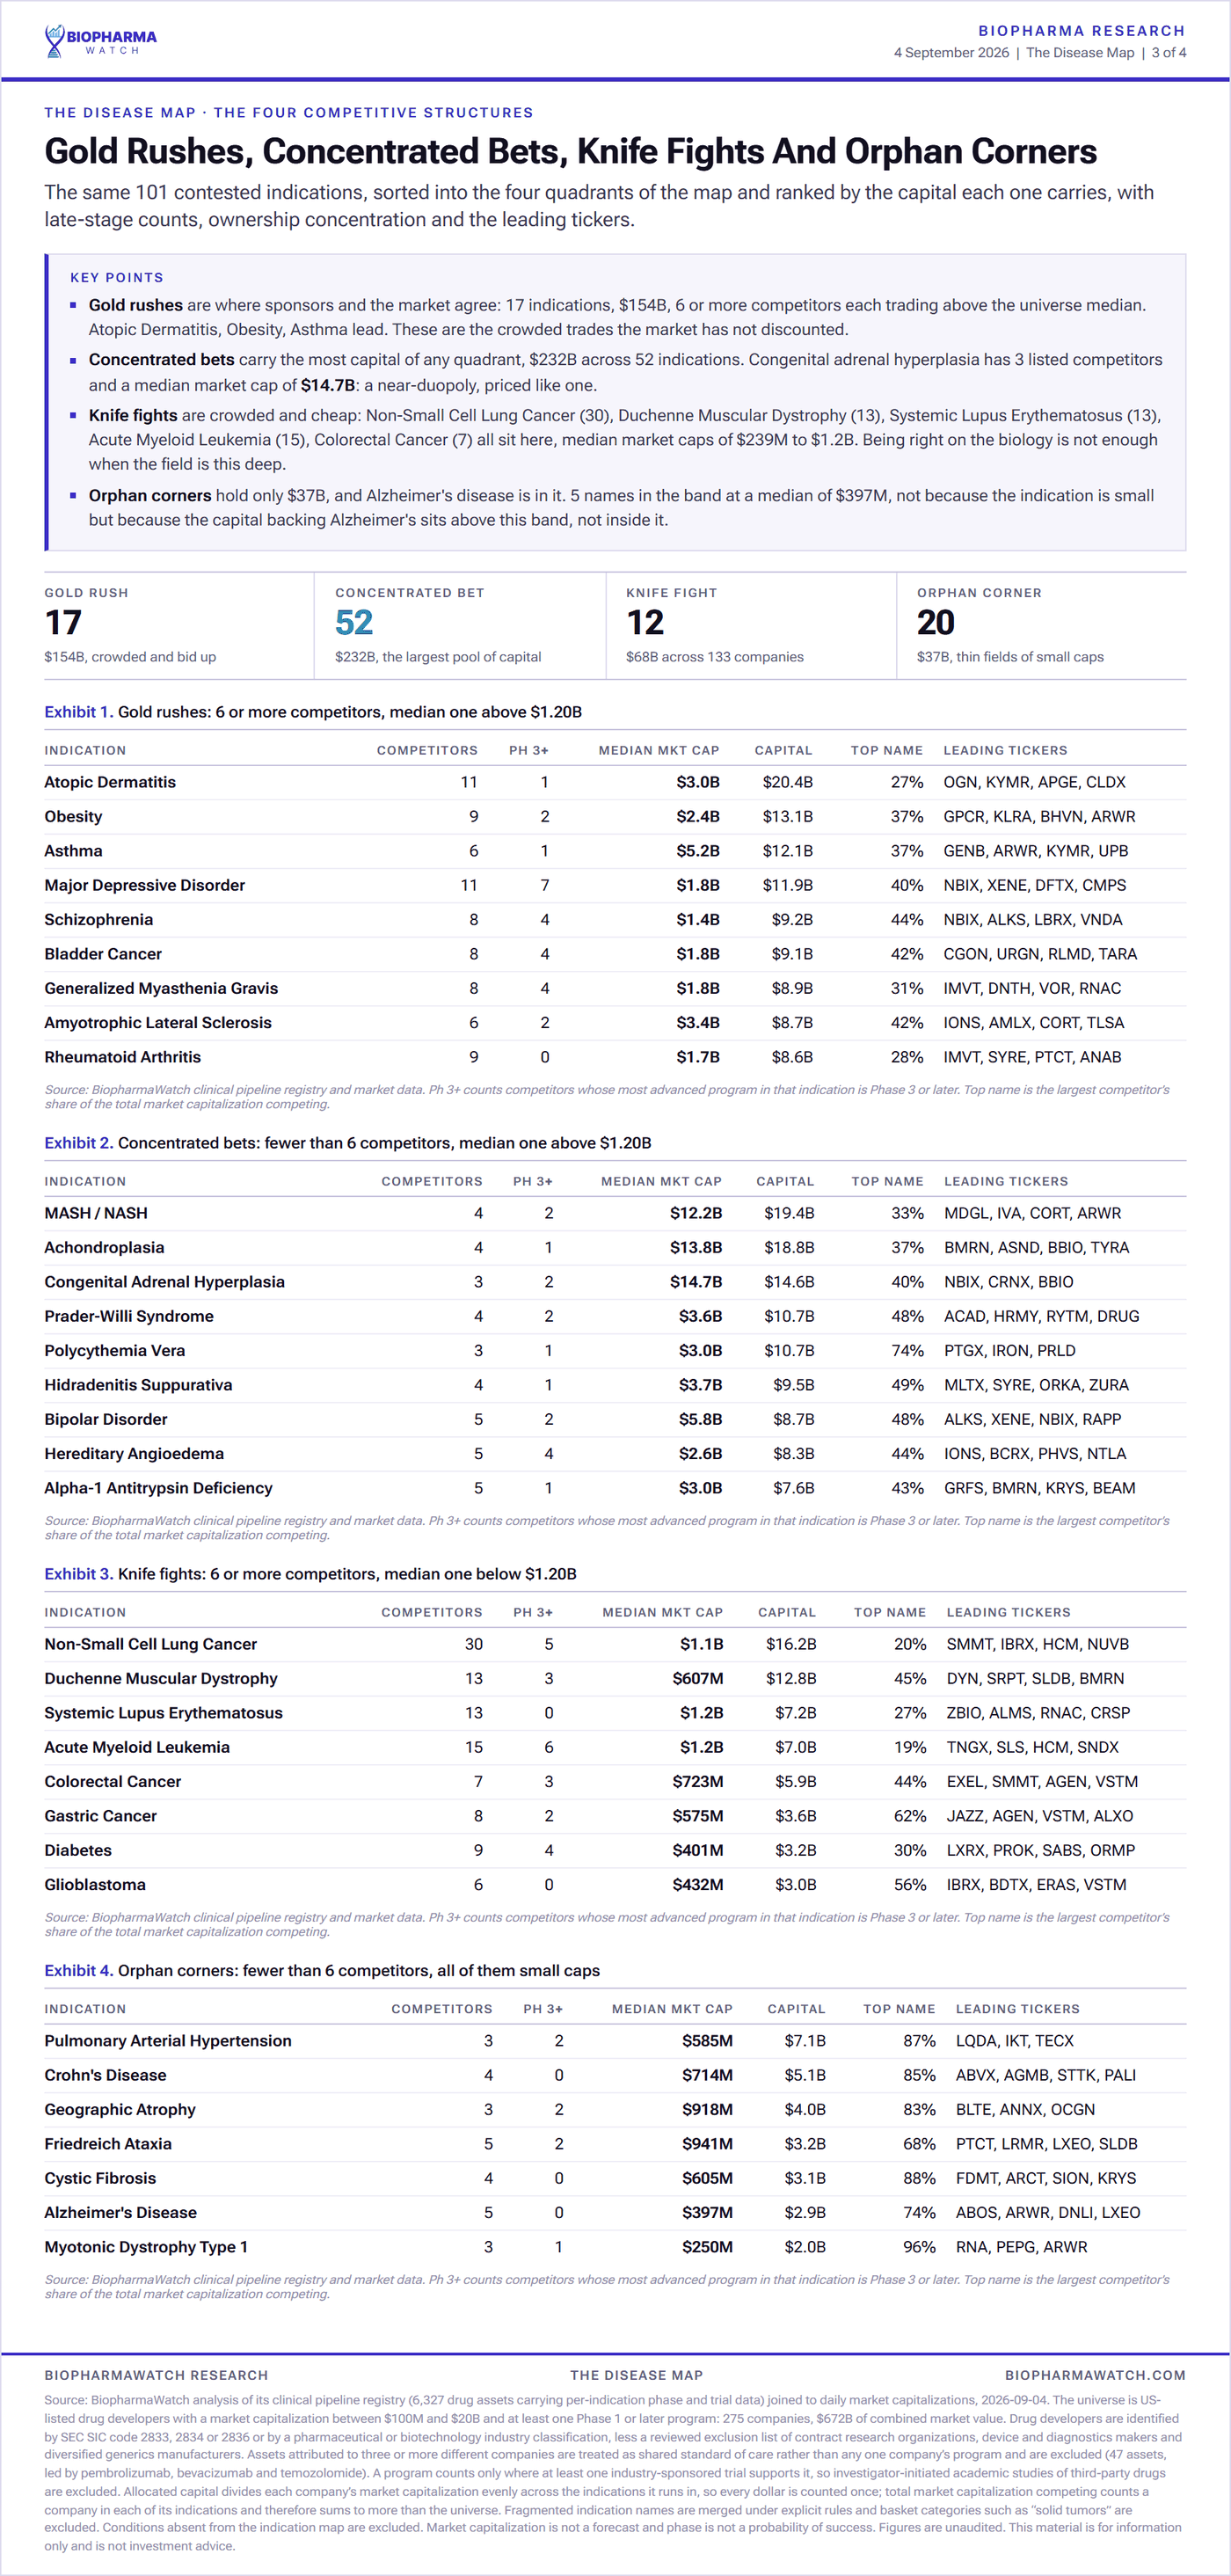
Non-small cell lung cancer, with 30 listed developers in the band. Acute myeloid leukemia is second with 15, then Duchenne muscular dystrophy and systemic lupus erythematosus with 13 each. Only 7 indications out of 299 carry ten or more.
In lung cancer the field includes SMMT, IBRX, HCM, NUVB, AVBP, JAZZ, IOVA, RCUS among others. SMMT is running ivonescimab in Phase 3 there; IBRX spans 12 indications across the map.
Crowding is not the same as depth, which is the trap in reading a competitor count on its own. Lung cancer's 30 split 5 late stage, 12 mid and 13 early. Systemic lupus has 13 competitors and 0 of them in late-stage trials, so the queue there is entirely a bet on biology that nobody has proved yet.
What are the four competitive structures on the disease map?
Every contested indication falls into one of four shapes, set by how many companies compete and what the median one is worth. Concentrated bet is the largest by capital at $232B, more than the gold rush and knife fight quadrants combined.
Structure
Indications
Allocated capital
What it means
Concentrated bet
52
$232B
Few competitors, each one large. The market pays a scarcity premium to compete here.
Gold rush
17
$154B
Crowded and richly priced: six or more competitors, and the median one is worth more than the median small or mid cap biotech.
Knife fight
12
$68.0B
Crowded and cheaply priced. Six or more competitors and a median company below the universe median.
Orphan corner
20
$37.0B
A thin field of small caps. Few competitors, none of them large.
The knife fights are where being right on the biology is not enough. Breast cancer runs 10 deep with a median company of $288M, and OLMA is in Phase 3 there at under a billion. Nine of the 12 knife fights are oncology.
A median of $288M tells you what the field costs. It does not tell you which of those companies can fund the trial that decides it. Cash runway, monthly burn and dilution risk for every company on this map are subscriber fields. A free trial opens them.
Which diseases have the most biotech capital behind them?
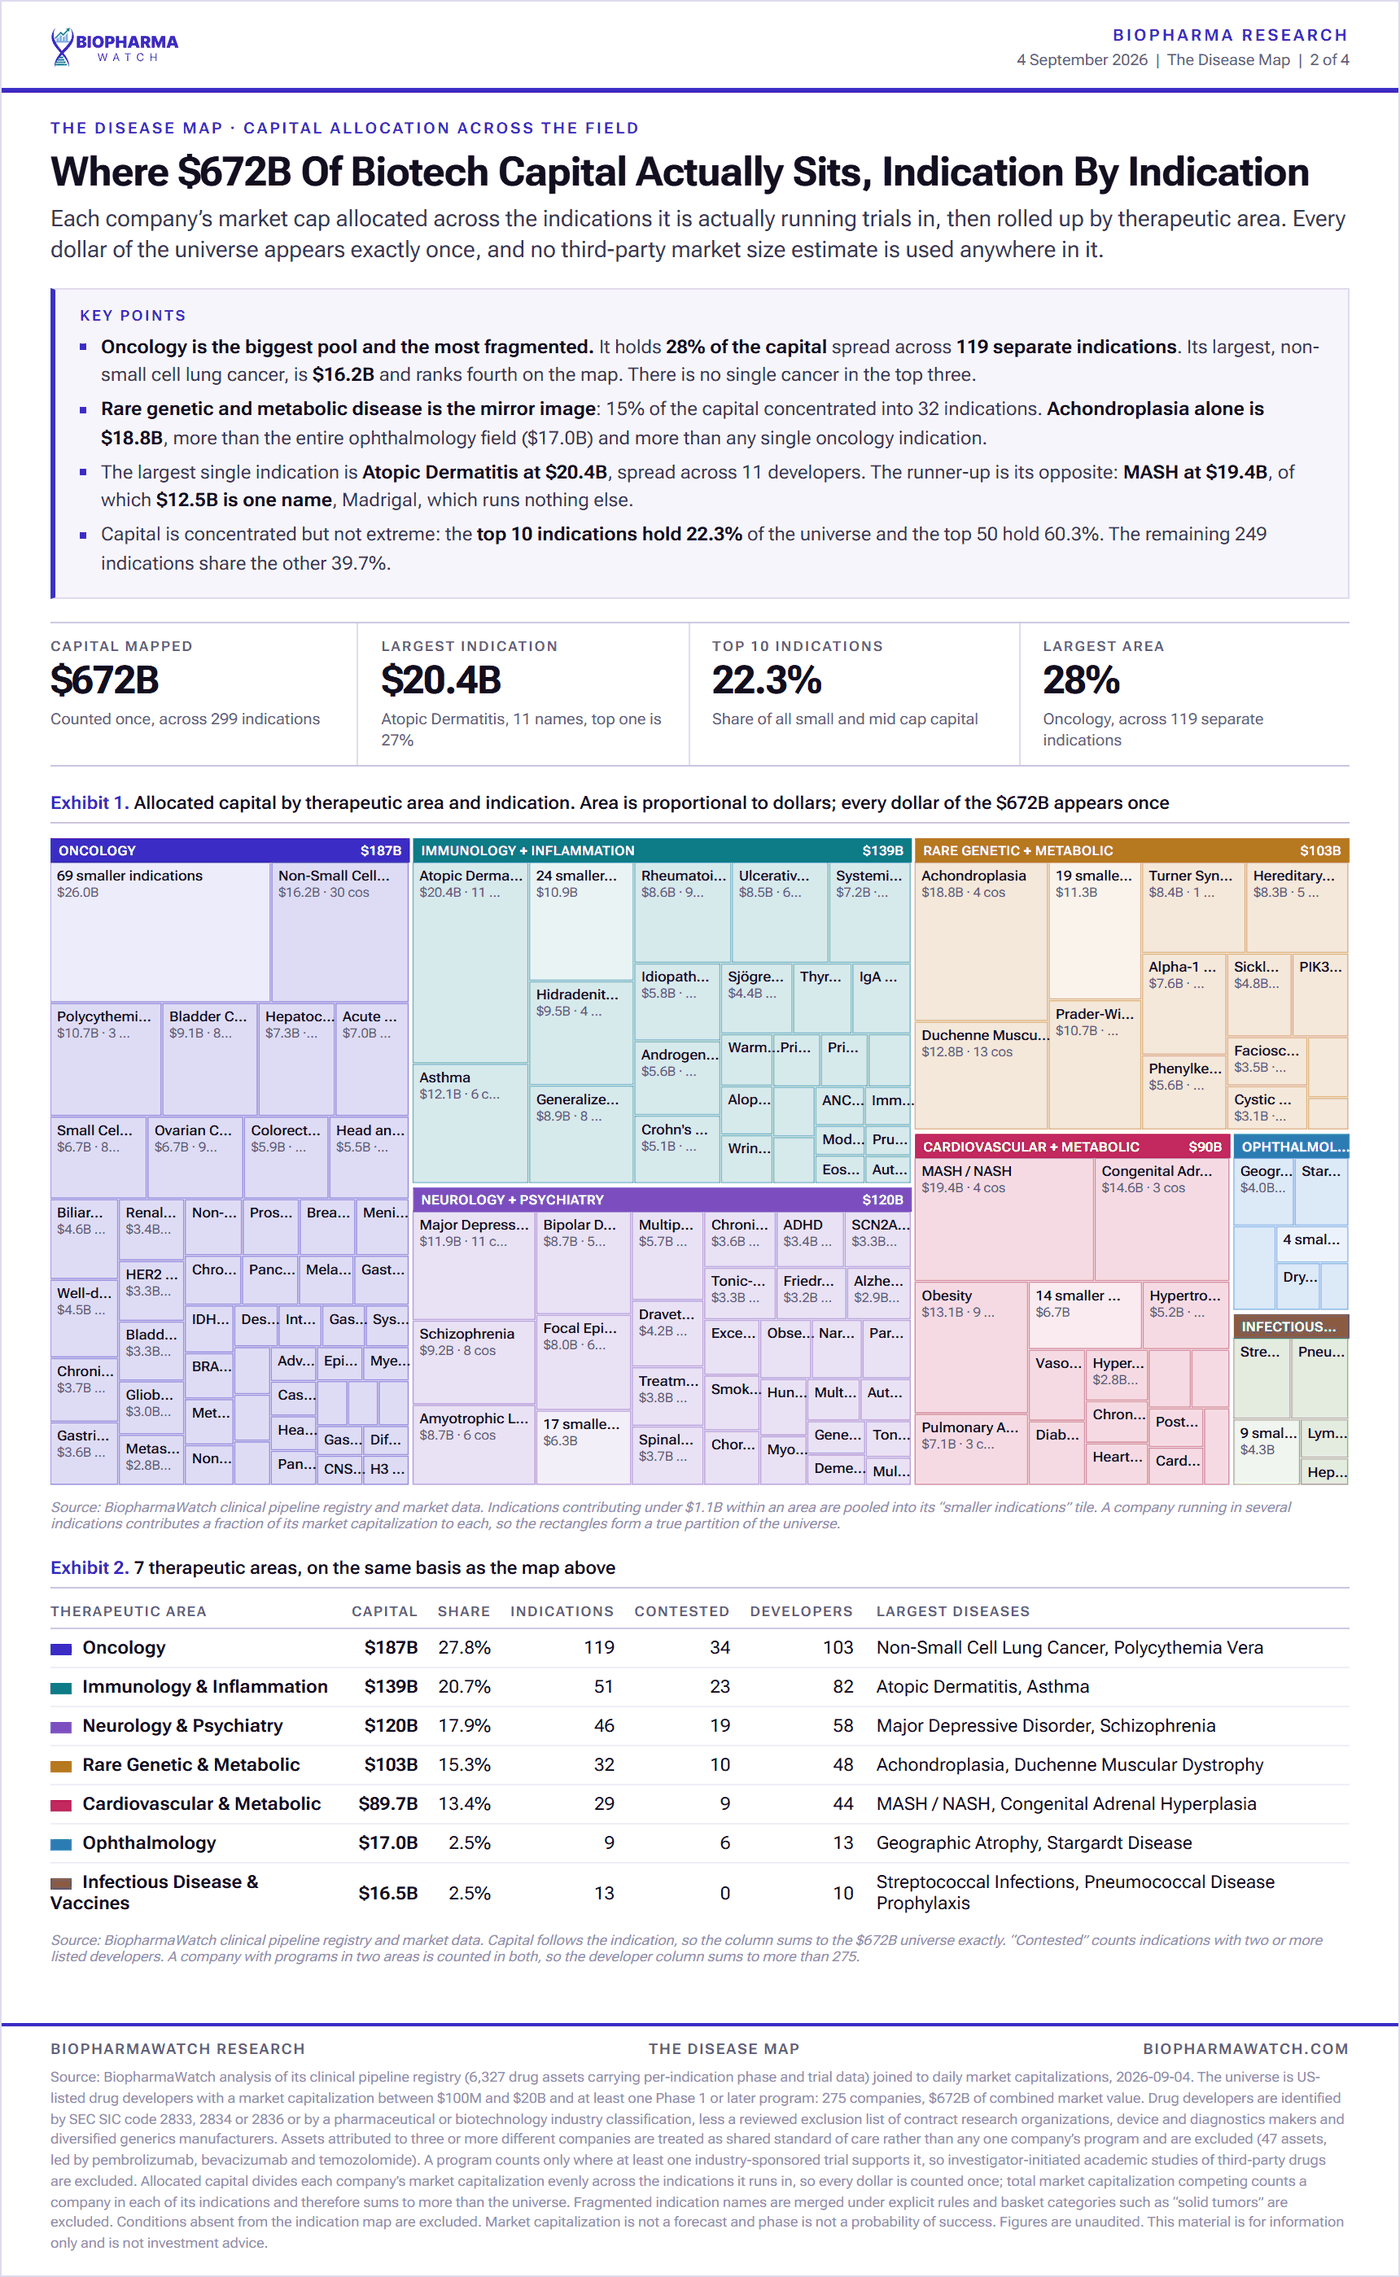
Atopic dermatitis, at $20.4B of allocated capital across 11 competitors. MASH is second at $19.4B with only 4, achondroplasia third at $18.8B. The top ten indications hold 22.3% of the $672B universe and the top fifty hold 60.3%.
Indication
Therapeutic area
Competitors
Median company
Allocated capital
Structure
Atopic Dermatitis
Immunology & Inflammation
11
$3.0B
$20.4B
Gold rush
MASH (NASH)
Cardiovascular & Metabolic
4
$12.2B
$19.4B
Concentrated bet
Achondroplasia
Rare Genetic & Metabolic
4
$13.8B
$18.8B
Concentrated bet
Non-Small Cell Lung Cancer
Oncology
30
$1.1B
$16.2B
Knife fight
Congenital Adrenal Hyperplasia
Cardiovascular & Metabolic
3
$14.7B
$14.6B
Concentrated bet
Obesity
Cardiovascular & Metabolic
9
$2.4B
$13.1B
Gold rush
Duchenne Muscular Dystrophy
Rare Genetic & Metabolic
13
$607M
$12.8B
Knife fight
Asthma
Immunology & Inflammation
6
$5.2B
$12.1B
Gold rush
Major Depressive Disorder
Neurology & Psychiatry
11
$1.8B
$11.9B
Gold rush
Prader-Willi Syndrome
Rare Genetic & Metabolic
4
$3.6B
$10.7B
Concentrated bet
In atopic dermatitis the field runs OGN, KYMR, APGE, CLDX, CRVS, ACRS, with KYMR holding 27.2% of the capital in it. MASH is the opposite shape: MDGL, IVA, CORT, ARWR, and MDGL alone is most of it. In achondroplasia it is BMRN, ASND, BBIO, TYRA, four companies and a $13.8B median.
Allocated capital is not the same as total market value competing. Total market capitalisation in lung cancer is $82.3B against $16.2B allocated, because almost nobody in lung cancer is only in lung cancer.
How many diseases have only one listed biotech developer?
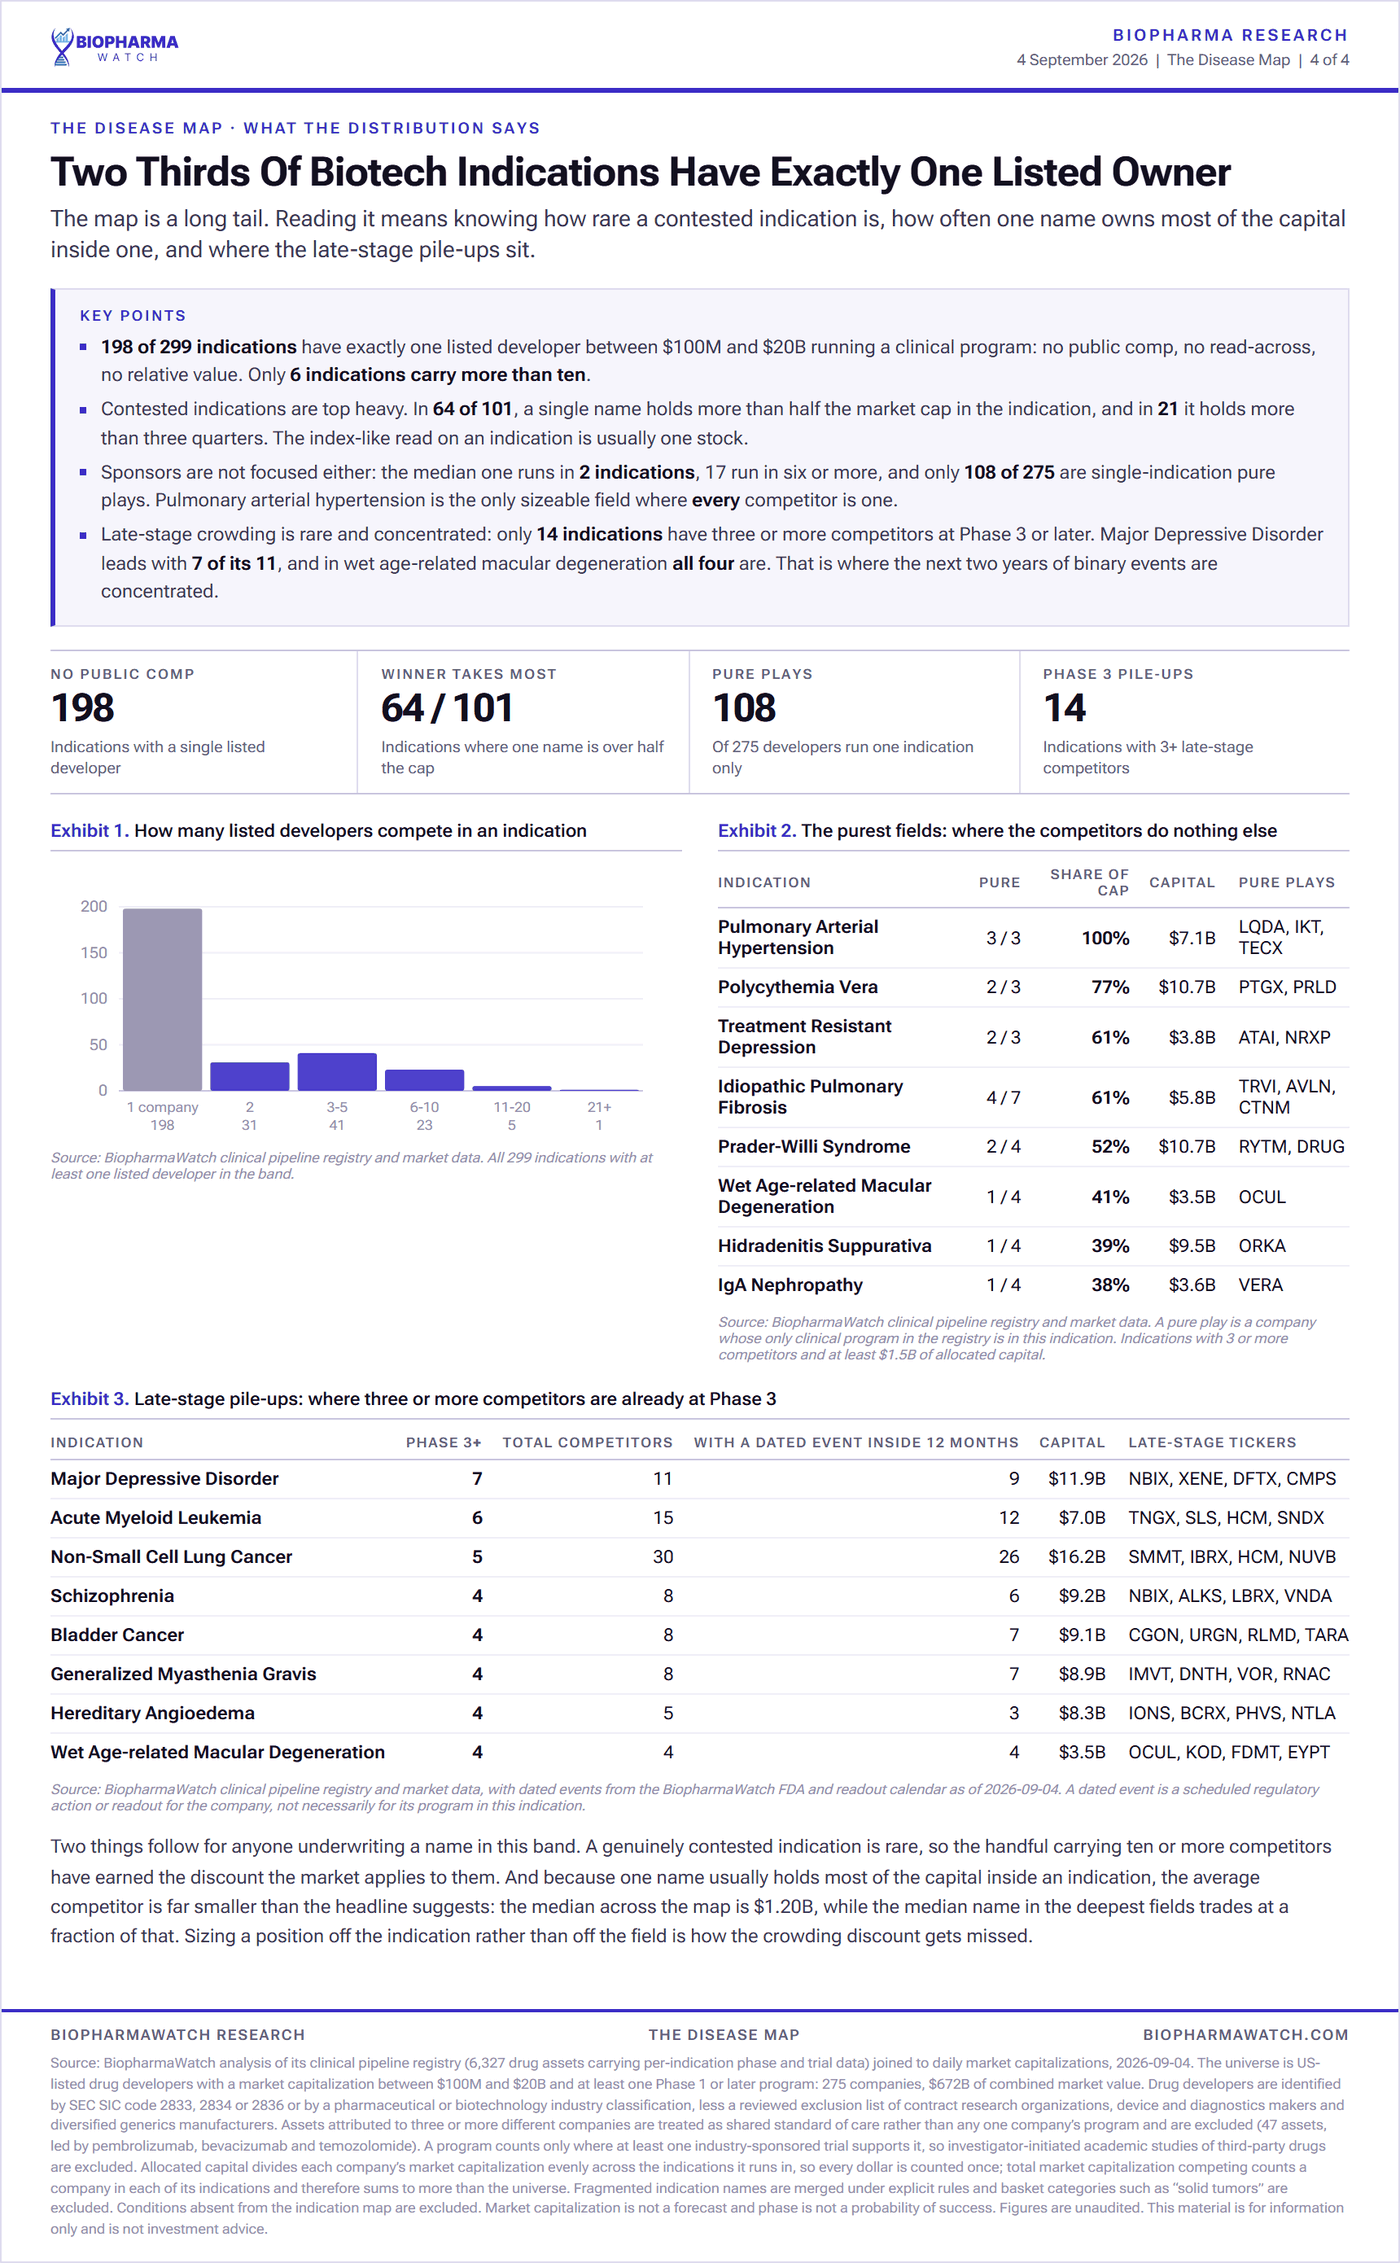
198 of 299, which is 66% of the map. Those indications hold $181B between them. For a company sitting alone in its indication there is no comparable, no relative value and nothing else that re-rates when it reads out.
This is where rare disease concentrates. Rare Genetic and Metabolic covers 32 indications with only 10 contested, and it is the therapeutic area where a single company most often owns the whole field. RYTM holds 47.6% of Prader-Willi syndrome; ORKA and SYRE split most of hidradenitis suppurativa; DYN is a pure play in Duchenne.
108 of the 275 companies on the map run trials in exactly one indication. That is the binary end of the sector, and it is a third of it.
Does one company usually dominate a contested indication?
Yes, far more often than the word "contested" suggests. In 64 of the 101 indications with more than one competitor, a single company holds over half the market capitalisation competing. In 21 of them it holds more than three quarters.
PTGX holding 73.5% of polycythemia vera is the cleanest example: three competitors on paper, one company that is almost the entire field by value. ARWR, JAZZ and KYMR do the same thing in their own indications.
Knowing that one company is most of a field is the start of the question, not the end of it. Which funds are behind it, what the options market is pricing into its next readout, and where it sits on our pipeline valuation score are subscriber data. Open a free trial to see them for any company on this map.
Which therapeutic area has the most biotech companies?
Oncology, with 103 companies and $187B of allocated capital across 119 indications, 27.8% of the universe. Immunology and inflammation follows with 82 companies, then neurology and psychiatry with 58.
Therapeutic area
Companies
Indications
Contested
Allocated capital
Share of $672B
Oncology
103
119
34
$187B
27.8%
Immunology & Inflammation
82
51
23
$139B
20.7%
Neurology & Psychiatry
58
46
19
$120B
17.9%
Rare Genetic & Metabolic
48
32
10
$103B
15.3%
Cardiovascular & Metabolic
44
29
9
$89.7B
13.4%
Ophthalmology
13
9
6
$17.0B
2.5%
Infectious Disease & Vaccines
10
13
0
$16.5B
2.5%
The number that stands out is the contested column. Oncology's $187B is spread across 119 indications, so it is wide rather than deep, and only 34 of those are contested. Infectious disease and vaccines has 0 contested indications out of 13, the only area on the map with none at all.
Why does the phase mix change what a competitor count means?
Because a competitor in Phase 1 and a competitor about to file are not the same threat. Two indications with the same count can be at completely different stages of being decided, and the count alone hides it.
Compare two 13-competitor fields. Duchenne muscular dystrophy splits 3 late, 9 mid and 1 early, so it is a race in its final third. Systemic lupus erythematosus splits 0 late, 3 mid and 10 early, so nobody there has proved anything yet. Same headline number, opposite situations.
Across the whole map there are 568 dated catalysts in the next twelve months, and the FDA calendar carries the regulatory dates behind them. In Duchenne, BMRN is the largest holder at 44.6% while SRPT, EWTX and DYN are all in the same field at very different sizes.
How should you use competitor counts when screening clinical stage biotech companies?
As a denominator, not a verdict. A competitor count tells you how many credible parties are chasing the same clinical outcome, which sets how much of the eventual market any one of them can expect and how much the market will pay per name today. It does not tell you who wins.
Three readings that hold up across the 299 indications here. A low count with a high median is a scarcity premium, and it can equally mean nobody else believes the biology. A high count with a low median is a discount you are being paid to accept only if you can pick the winner. And a high count where nobody is late stage, as in lupus, is a bet on biology dressed up as a race.
The biotech screener filters the same universe by market capitalisation, phase and therapeutic area, and the clinical trial monitor holds the underlying study records. 108 of these companies are one readout away from a complete re-rating. A free trial opens cash runway, dilution risk and the pipeline valuation score on all 275.
How is the disease map built, and what is excluded?
The universe is US-listed drug developers capitalised [object Object] running at least one industry-sponsored clinical programme, measured as of 2026-09-04. Market value is allocated evenly across the indications a company runs trials in, so a company working in seven diseases contributes one seventh of its value to each and every dollar of the $672B is counted exactly once.
Excluded by design: companies above $20 billion or below $100 million; approved incumbents in competitor counts; assets attributed to three or more companies, which are treated as shared standard of care; investigator-initiated academic studies of third-party drugs; and third-party market size estimates, which are not used anywhere on this page.
The figures are rebuilt from current filings, trial records and same-day market capitalisations rather than held as a static snapshot. Competitor counts are what we can resolve, so read them as floors.
How do you look up the companies competing in a single disease?
Every indication has its own page. The interactive disease map filters all 299 by therapeutic area, competitive structure, competitor count or capital, and opening any indication gives the complete competitor list with drug, phase, trial count, market capitalisation and next dated catalyst.
Part III takes the same universe one level down, from diseases to the molecules themselves: the most crowded drug targets in biotech, where 19 companies are chasing a single antigen.
This material is for information only and is not investment advice or a recommendation to buy or sell any security. Market capitalisations and competitive structures change; the map is rebuilt from current filings and trial records rather than frozen.
Frequently asked questions
Which biotech companies are developing drugs for a specific disease?›
The BiopharmaWatch Disease Map lists every US-listed drug developer capitalised between $100 million and $20 billion running an industry-sponsored clinical programme in each of 299 indications. Each indication page shows the full competitor list with drug name, phase, trial count, market capitalisation and next dated catalyst, so a question like which companies are developing drugs for obesity resolves to one page rather than an afternoon of searching.
How many biotech companies compete in the average disease?›
One. Of 299 indications, 198 have exactly one listed developer inside the band and only 101 are contested by two or more companies. The most crowded is non-small cell lung cancer with 30 competitors, followed by acute myeloid leukemia with 15, then Duchenne muscular dystrophy and systemic lupus erythematosus with 13 each.
Which rare disease biotech companies have no listed competitor?›
Rare Genetic and Metabolic carries 32 indications of which only 10 are contested, so it is the therapeutic area where a single company most often holds an entire field. Examples where one company is effectively the whole indication include Rhythm in Prader-Willi syndrome at 47.6% of the capital competing, and Protagonist in polycythemia vera at 73.5%.
Does more competition mean a disease is more valuable?›
The data says the opposite inside this universe. Indications with two or three competitors carry a median company market capitalisation of $2.6B, while indications with ten or more carry $1.2B. Crowded fields are usually crowded because entry is cheap, the odds of any one entrant winning fall as the field grows, and the largest developers leave the band once they pass $20 billion, so successful fields look thinner from inside this universe than they feel from outside it.
Which disease has the most biotech capital behind it?›
Atopic dermatitis, at $20.4B of allocated capital across 11 competitors. MASH is second at $19.4B with only 4 competitors, achondroplasia third at $18.8B, and non-small cell lung cancer fourth at $16.2B despite having 30 competitors. The top ten indications account for 22.3% of the $672B universe and the top fifty for 60.3%.
What is allocated capital and why not just add up market caps?›
Allocated capital divides each company market capitalisation evenly across the indications it runs clinical programmes in, so a company working in seven diseases contributes one seventh of its value to each and every dollar of the $672B universe is counted exactly once. Adding raw market capitalisations counts a multi-indication company many times over: total market capitalisation competing in non-small cell lung cancer is $82.3B against $16.2B of allocated capital, because almost nobody in lung cancer is only in lung cancer.
Which therapeutic area has the most biotech companies?›
Oncology, with 103 companies and $187B of allocated capital across 119 indications, 27.8% of the universe. Immunology and inflammation follows with 82 companies and $139B, then neurology and psychiatry with 58. Infectious disease and vaccines is the smallest by company count at 10 and has no contested indication at all.