Biotech Stocks Hedge Funds Are Buying: $127.3B Across 520 Names, Q2 2026
BWBiopharmaWatch Research··13 min read
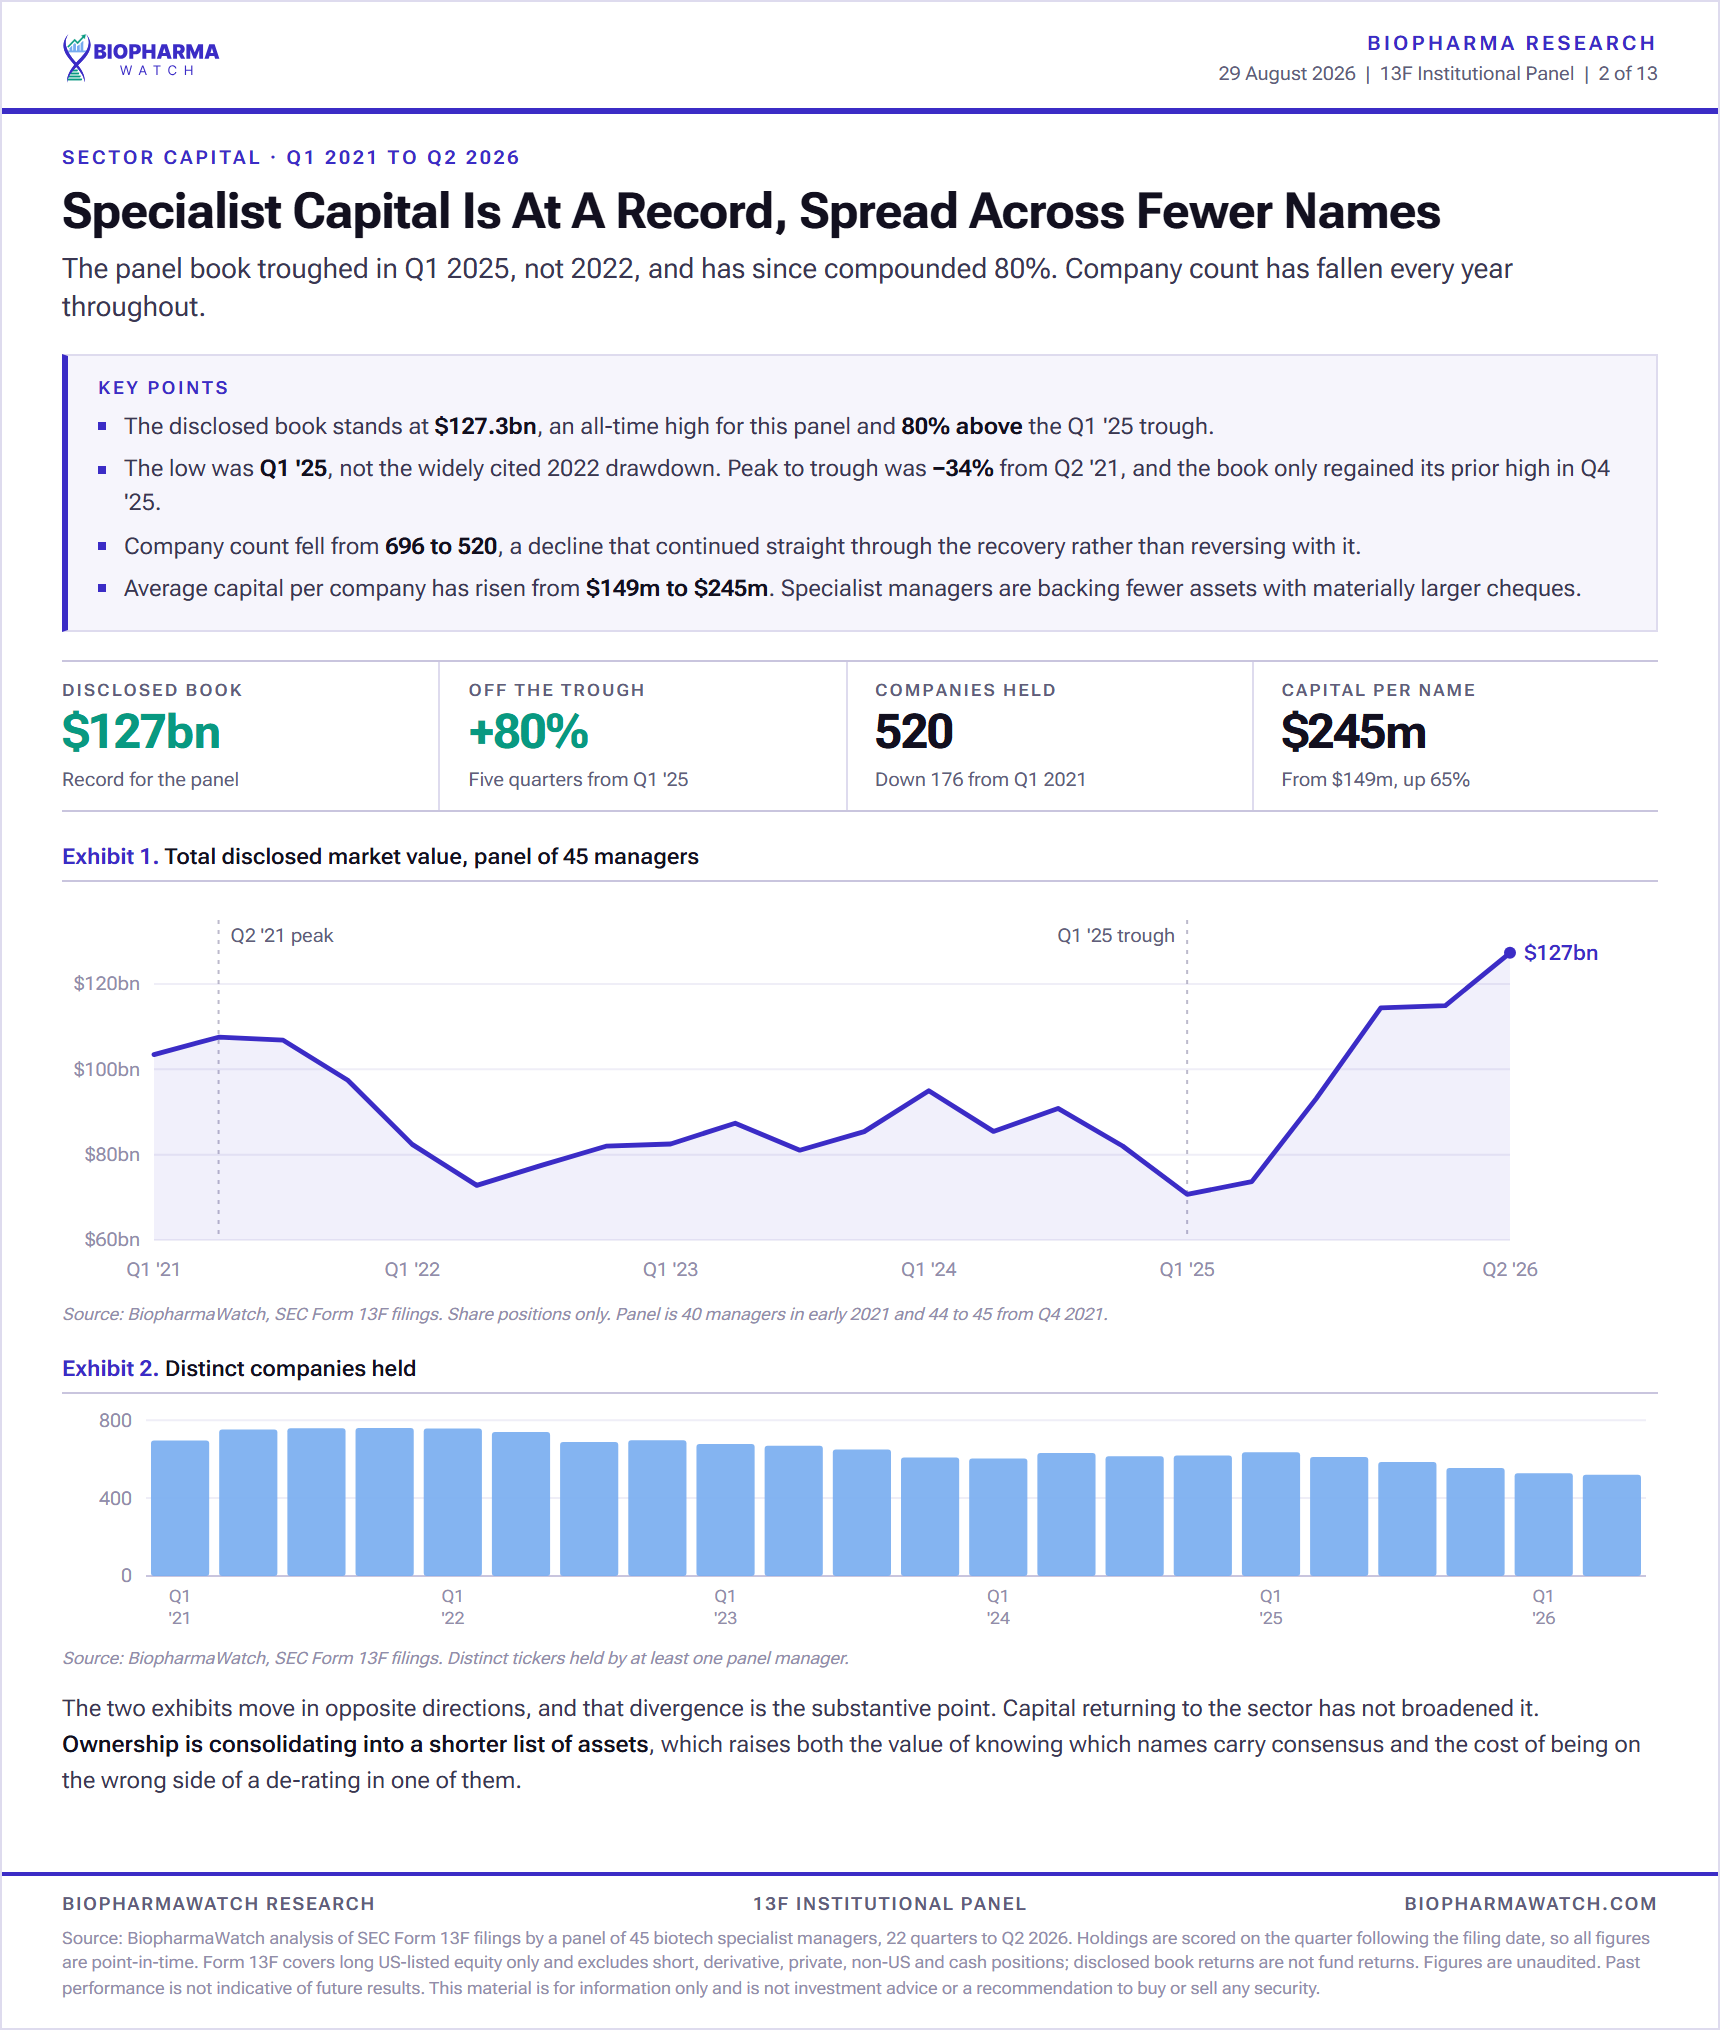
The 44 biotech specialist hedge funds that filed for Q2 2026 disclosed $127.3 billion of US-listed drug developers, the largest disclosed book in the 22 quarters we track, spread across just 520 companies, the fewest they have ever held. In Q1 2021 the same panel held 696 names. Record capital is going into a shrinking list.
This analysis covers 22 quarters of 13F filings, Q1 2021 through Q2 2026, from up to 45 biotech-dedicated managers, 9,296 positions ever opened. Every return figure below is point-in-time by construction: a holding in quarter Q earns its stock's return in quarter Q+1, the window that opens only after the filing became public. Where a result fails its significance test, we say so, including when the failing result is the flattering one.
Which biotech stocks do the most hedge funds own in Q2 2026?
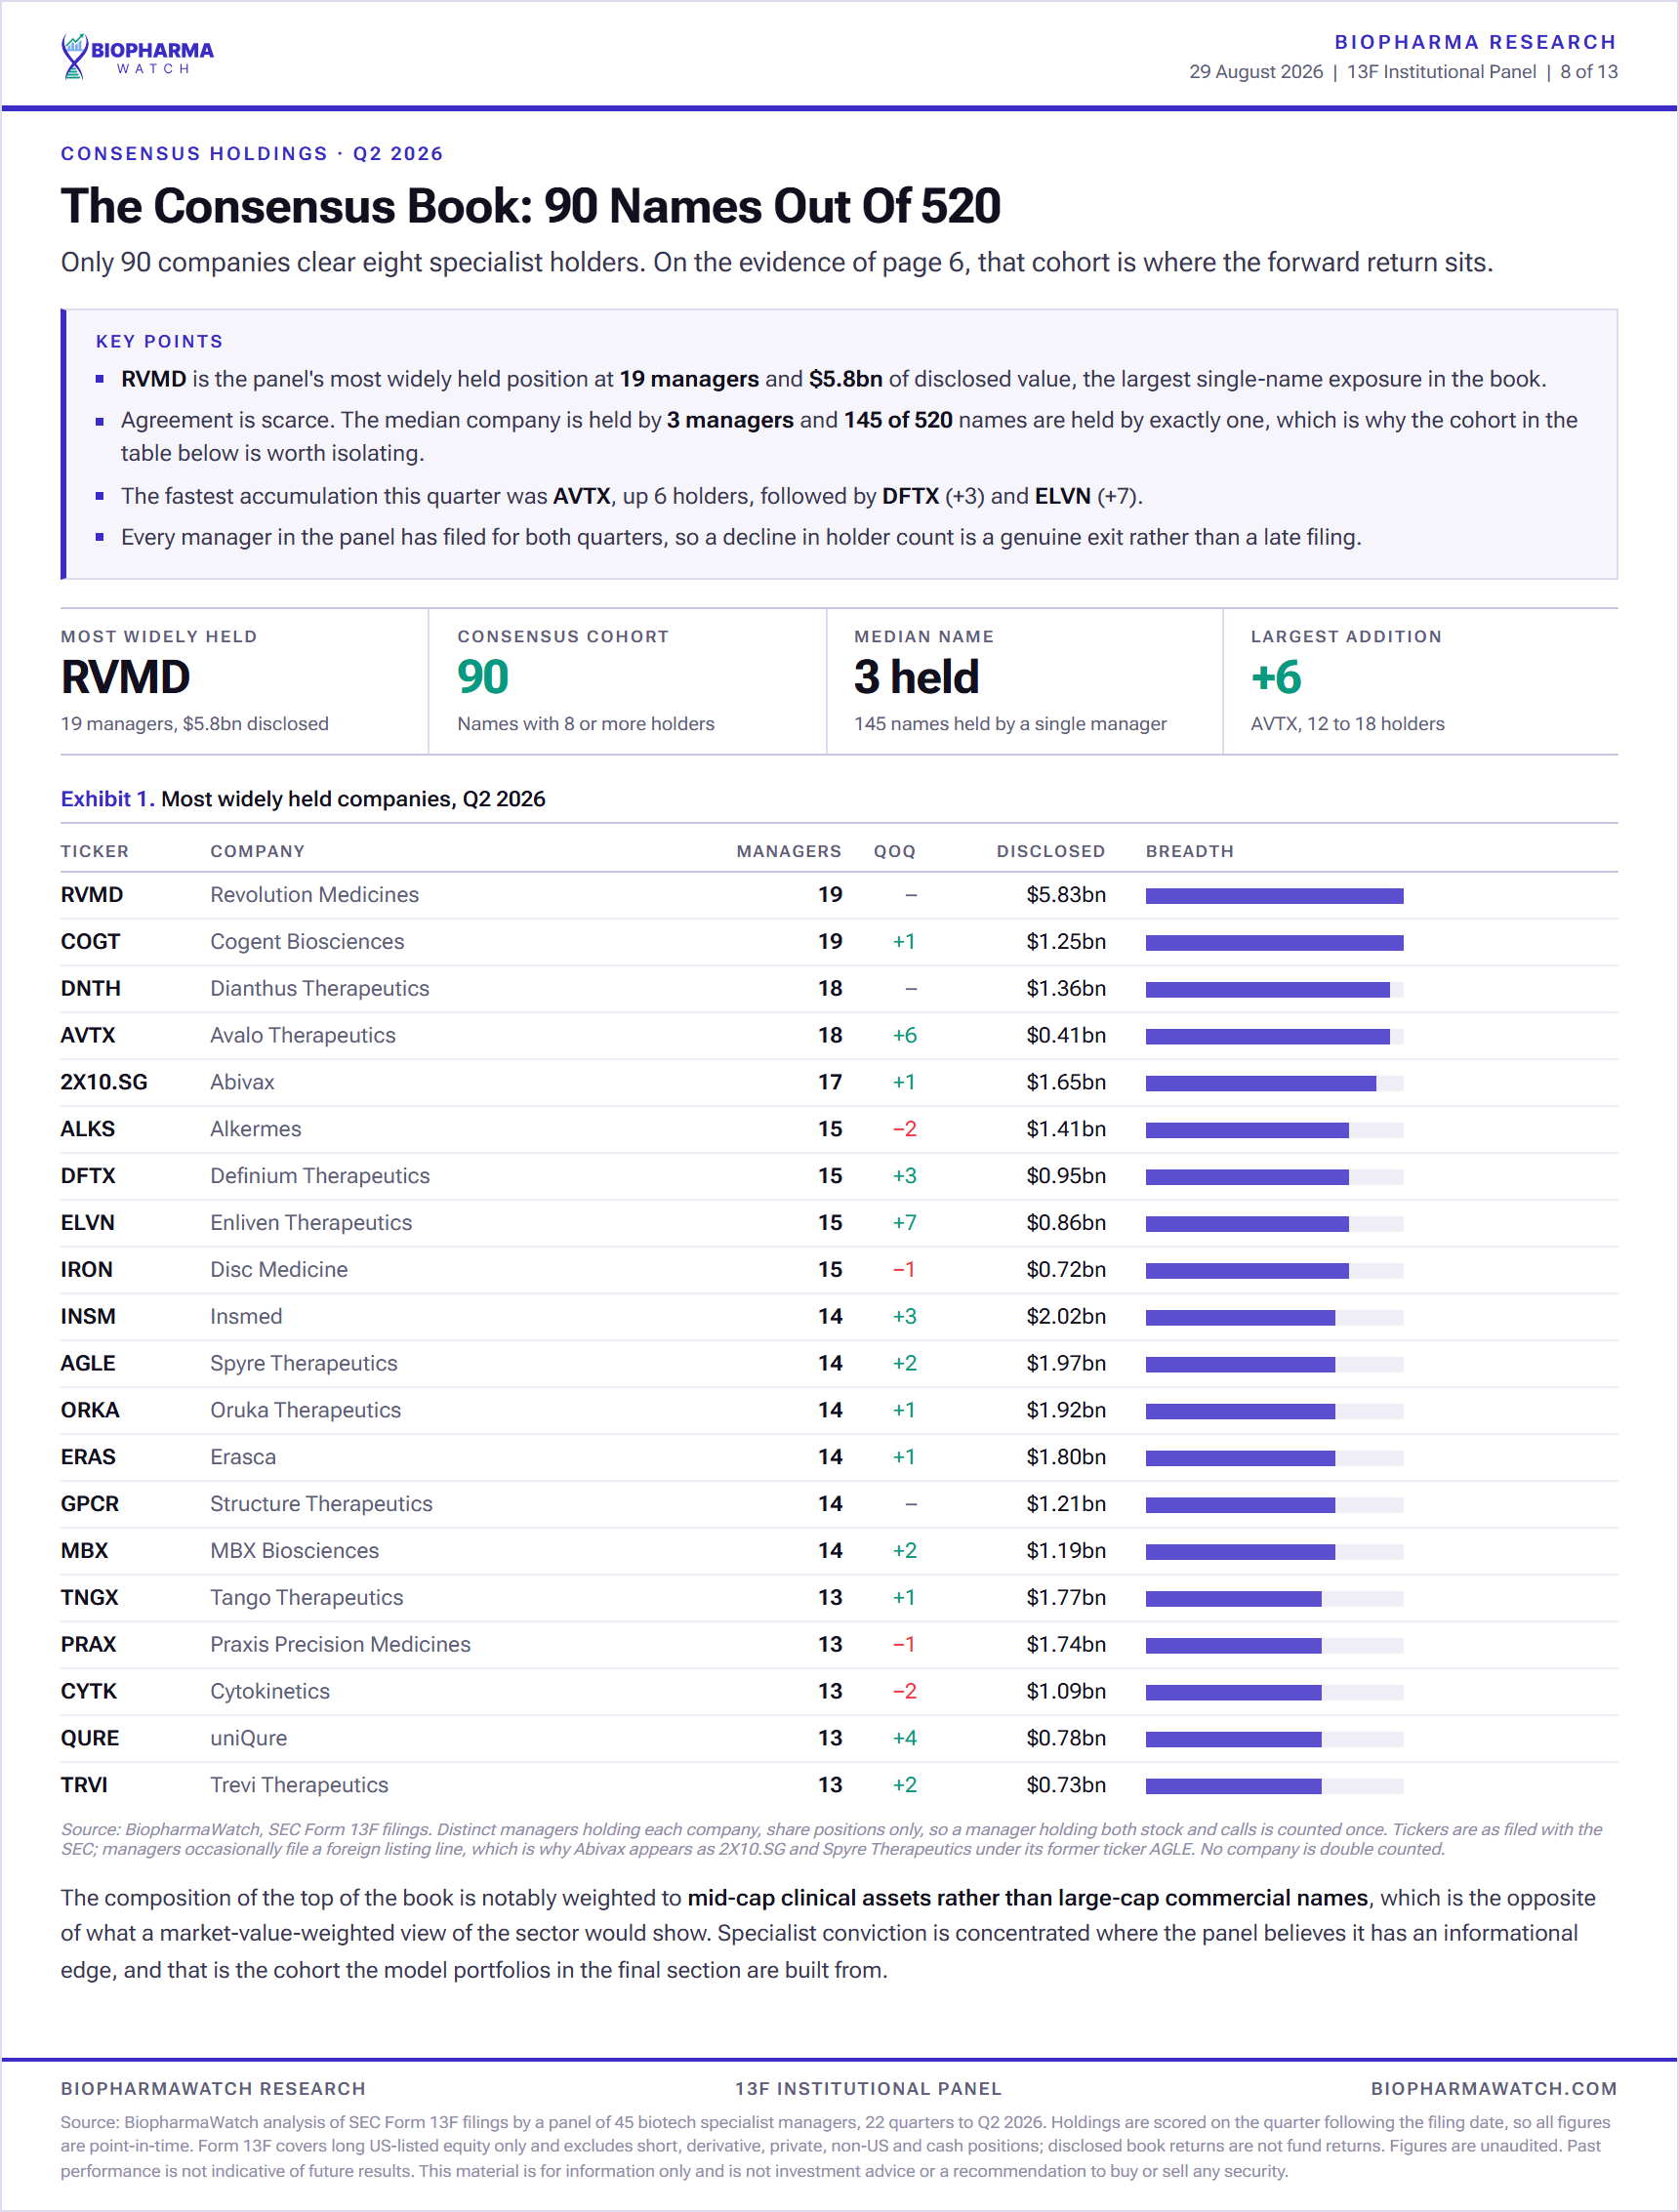
RVMD and COGT lead at 19 of the 44 panel funds each. The median company in the book is held by just 3 funds and the mean by 4.21, so 19 holders is an extreme, not a typical figure. 145 of the 520 companies are held by exactly one fund.
The table below is every name held by ten or more panel funds in Q2 2026, with the change against the prior quarter and the combined market value disclosed.
Two symbols need a note. The panel files ABIVAX on its Stuttgart line rather than the US ADR, and Spyre Therapeutics still appears under the Aeglea ticker it was renamed from. Both are linked to the live US company page above.
How much money do biotech specialist hedge funds manage in 2026?
The panel discloses $127.3 billion of US-listed equity across 2,188 positions. That is a record for this group, but the path there is not the one most people assume. The low point was Q1 2025 at $70.7 billion, not the 2022 drawdown.
Quarter
Disclosed book
Funds
Companies
Positions
Q2 '21
$107.5B
40
752
2,481
Q4 '21
$97.5B
44
760
2,562
Q2 '22
$72.8B
45
740
2,451
Q4 '22
$82.0B
45
697
2,438
Q2 '23
$87.4B
45
669
2,468
Q4 '23
$85.4B
45
609
2,339
Q2 '24
$85.4B
45
631
2,516
Q4 '24
$82.0B
45
619
2,431
Q2 '25
$73.7B
45
611
2,236
Q4 '25
$114.4B
45
555
2,282
Q2 '26
$127.3B
44
520
2,188
Two trends run in opposite directions. Capital is at a high, and the company count has fallen every year since Q4 2021, from 760 names to 520. Position count fell far less, from 2,414 to 2,188, which tells you the funds did not stop making bets. They stopped spreading them across new companies.
Did the biotech book grow because funds bought, or because prices rose?
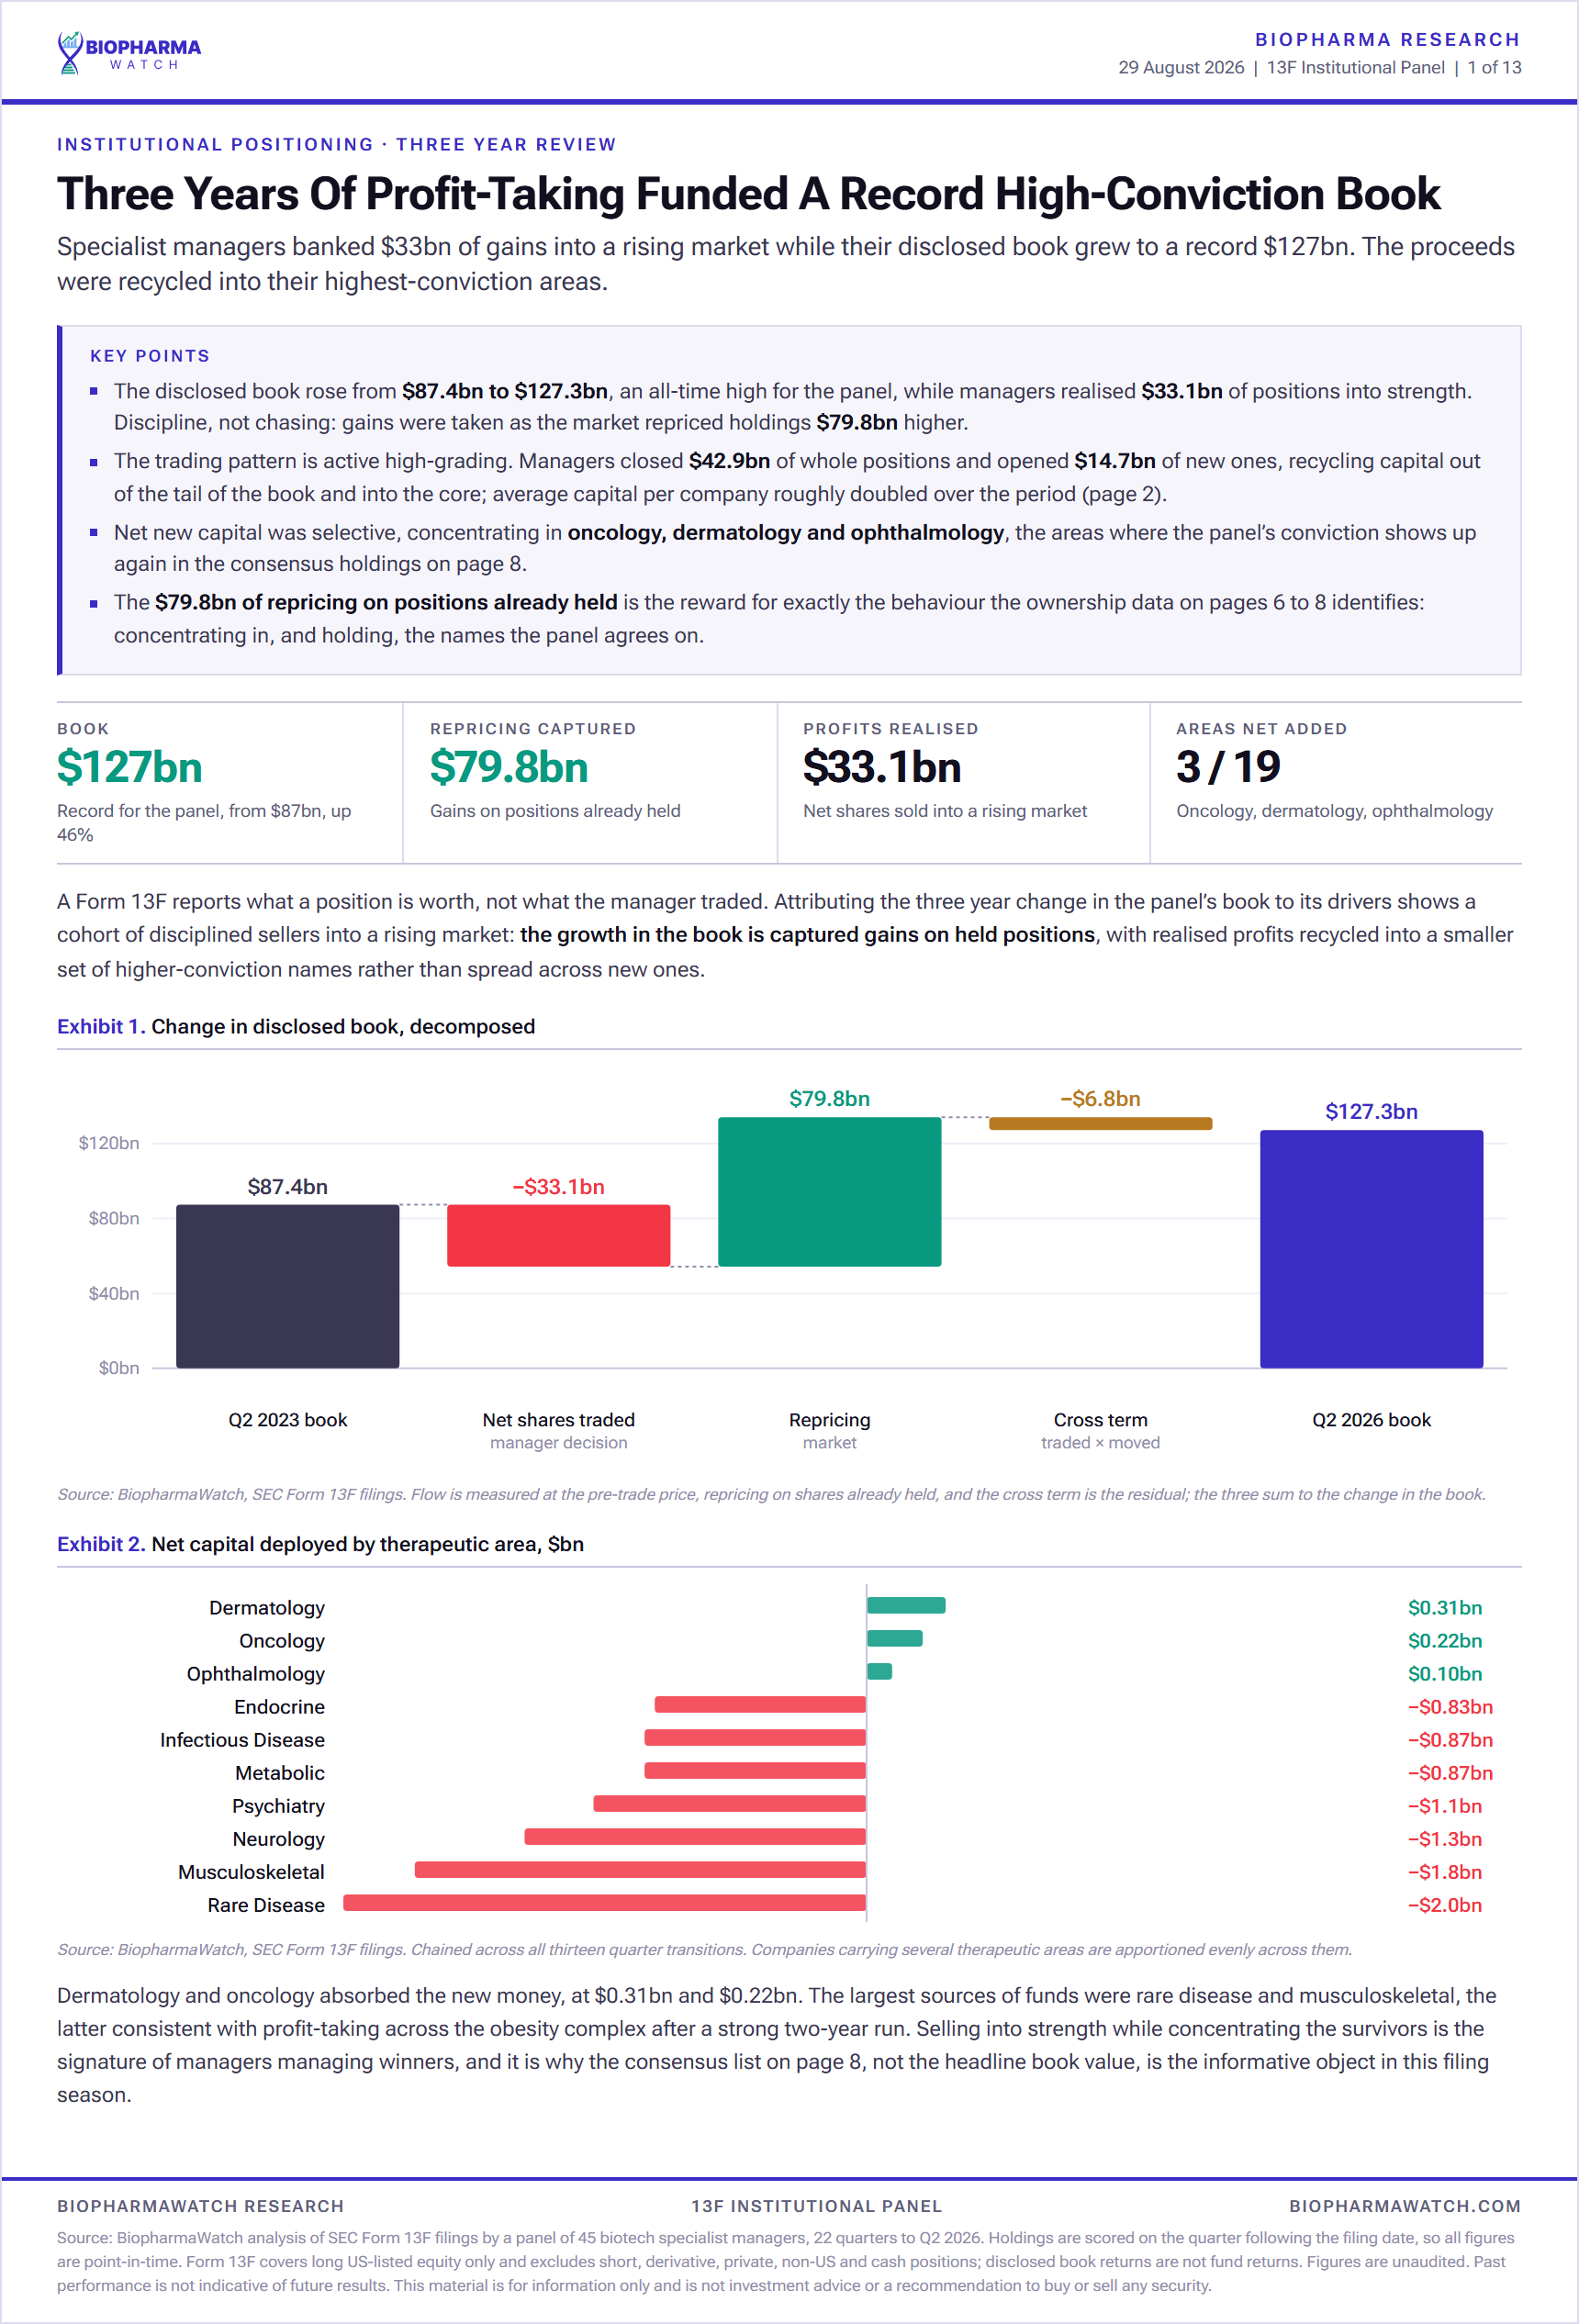
Prices, entirely. Over the three years to Q2 2026 the book grew $39.9 billion. Decomposed, price movement contributed +$79.8 billion while net trading contributed -$33.1 billion. These funds were net sellers throughout the rally.
The decomposition is an identity and has to reconcile: net flow -$33.1B plus price +$79.8B plus the interaction term -$6.8B equals the +$39.9B the book actually gained. Funds opened $14.7B of new positions and exited $42.9B, close to three dollars out for every dollar in.
This matters for how you read any 13F headline. A fund's position growing in dollar terms is usually the market repricing a holding it already had, not a manager adding conviction. Position count and share count are the honest measures of intent. Market value is mostly a price feed.
Does buying the most-owned biotech stocks actually work?
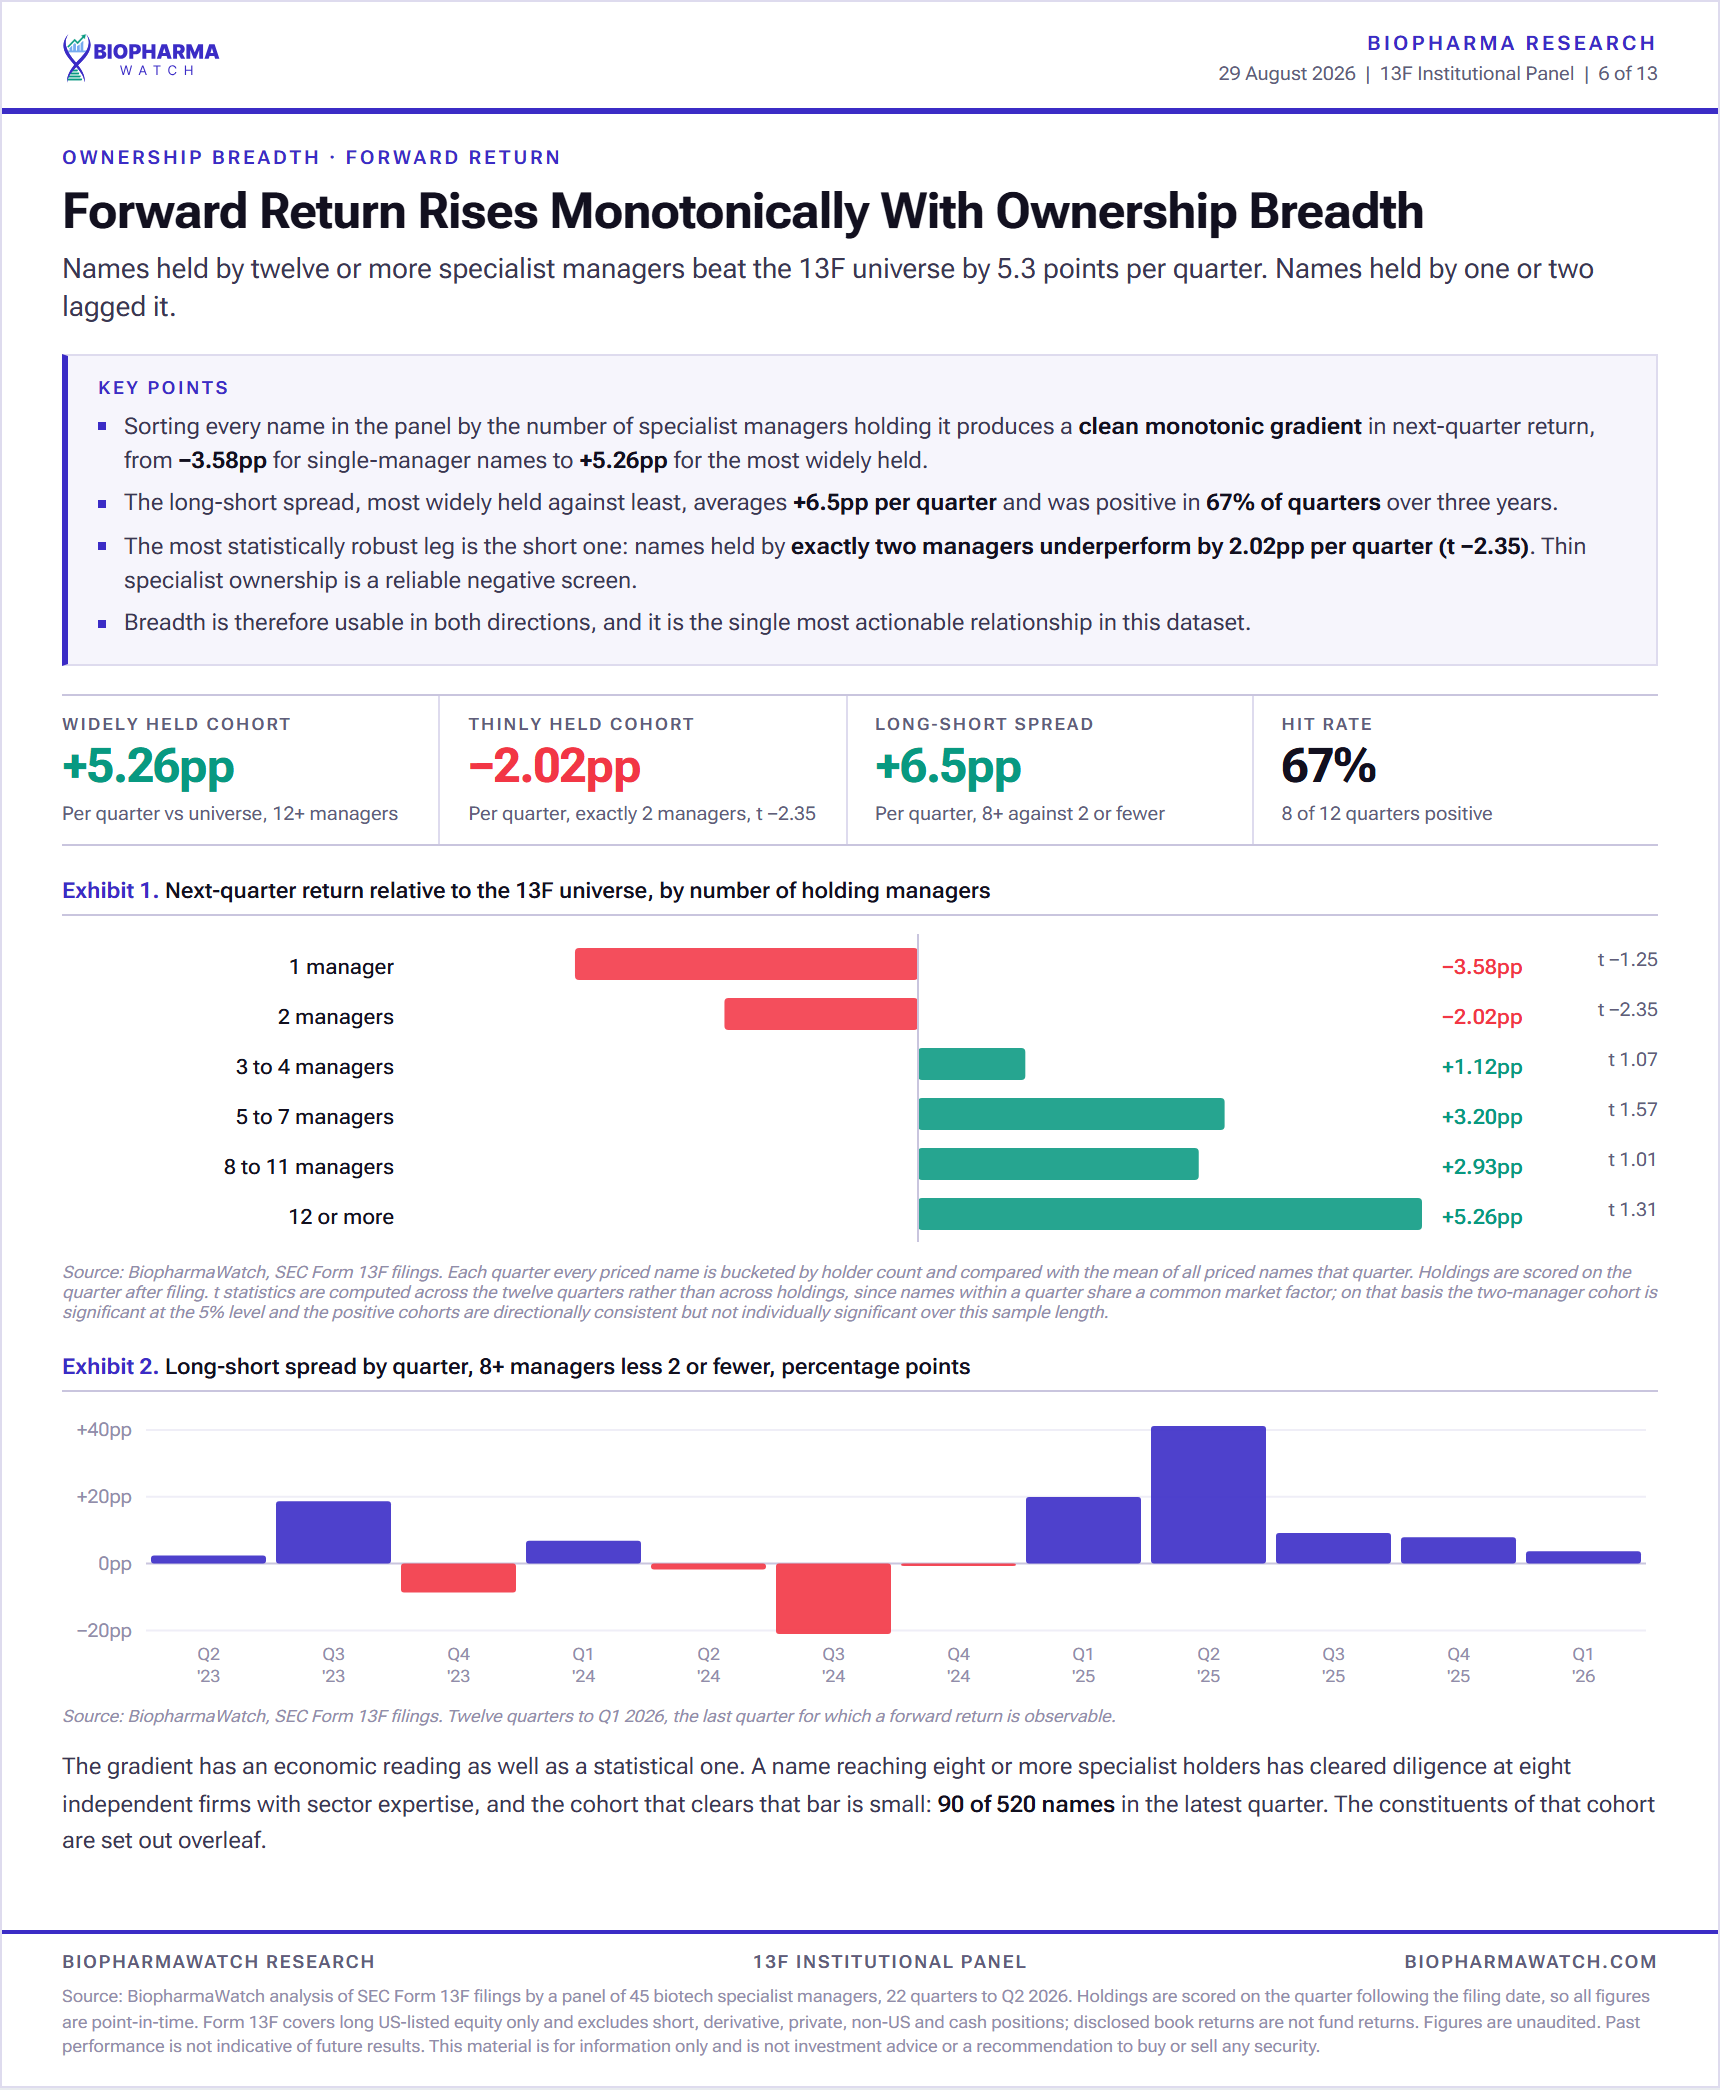
The pattern points that way and the statistics do not support it. Sorting every 13F name by how many panel funds hold it produces a clean staircase, from -3.58 points a quarter for names held by one fund up to +5.26 points for names held by twelve or more. But that top rung tests at t = 1.31, well under the bar.
Funds holding the name
Excess return per quarter
t statistic
Verdict at 5%
1 fund
-3.58pp
t = -1.25
not significant
2 funds
-2.02pp
t = -2.35
significant
3 to 4
+1.12pp
t = 1.07
not significant
5 to 7
+3.20pp
t = 1.57
not significant
8 to 11
+2.93pp
t = 1.01
not significant
12 or more
+5.26pp
t = 1.31
not significant
The consensus-minus-orphans spread, names held by eight or more funds against names held by two or fewer, averages +6.47 points a quarter and was positive in 67% of quarters. It still fails, at t = 1.44 over 12 quarters. The reason is dispersion, not the average: the spread ran from -21.1 points in Q3 2024 to +41.2 points in Q2 2025. A handful of quarters carry the entire mean.
Significance here is tested across quarters, never across holdings. Every name inside one quarter shares the same market, so they are not independent observations. Testing across the several hundred holdings instead would multiply each t by roughly fifteen and prove nothing at all.
Which hedge fund ownership signal does hold up statistically?
One, and it is a negative. Names held by exactly two panel funds lag the universe by 2.02 points a quarter at t = -2.35, which clears the 5% bar. Thin specialist ownership is a measurably bad sign. Heavy specialist ownership is only a promising one.
That asymmetry is more useful than it first looks. It says 13F data earns its keep as a screen-out rather than a screen-in. A biotech that two specialists have found and the other forty three have passed on is, on twelve quarters of evidence, a name to look at harder before buying. The same data cannot tell you that RVMD at 19 holders is a good buy, and we are not going to imply that it does.
Note also what is absent. Whether funds were adding, trimming or standing still in a name has no measurable relationship with what that name did next: the four activity buckets test at t = 0.92 and below. The direction of a manager's last trade is not a signal in this dataset.
Do concentrated biotech funds do better than diversified ones?
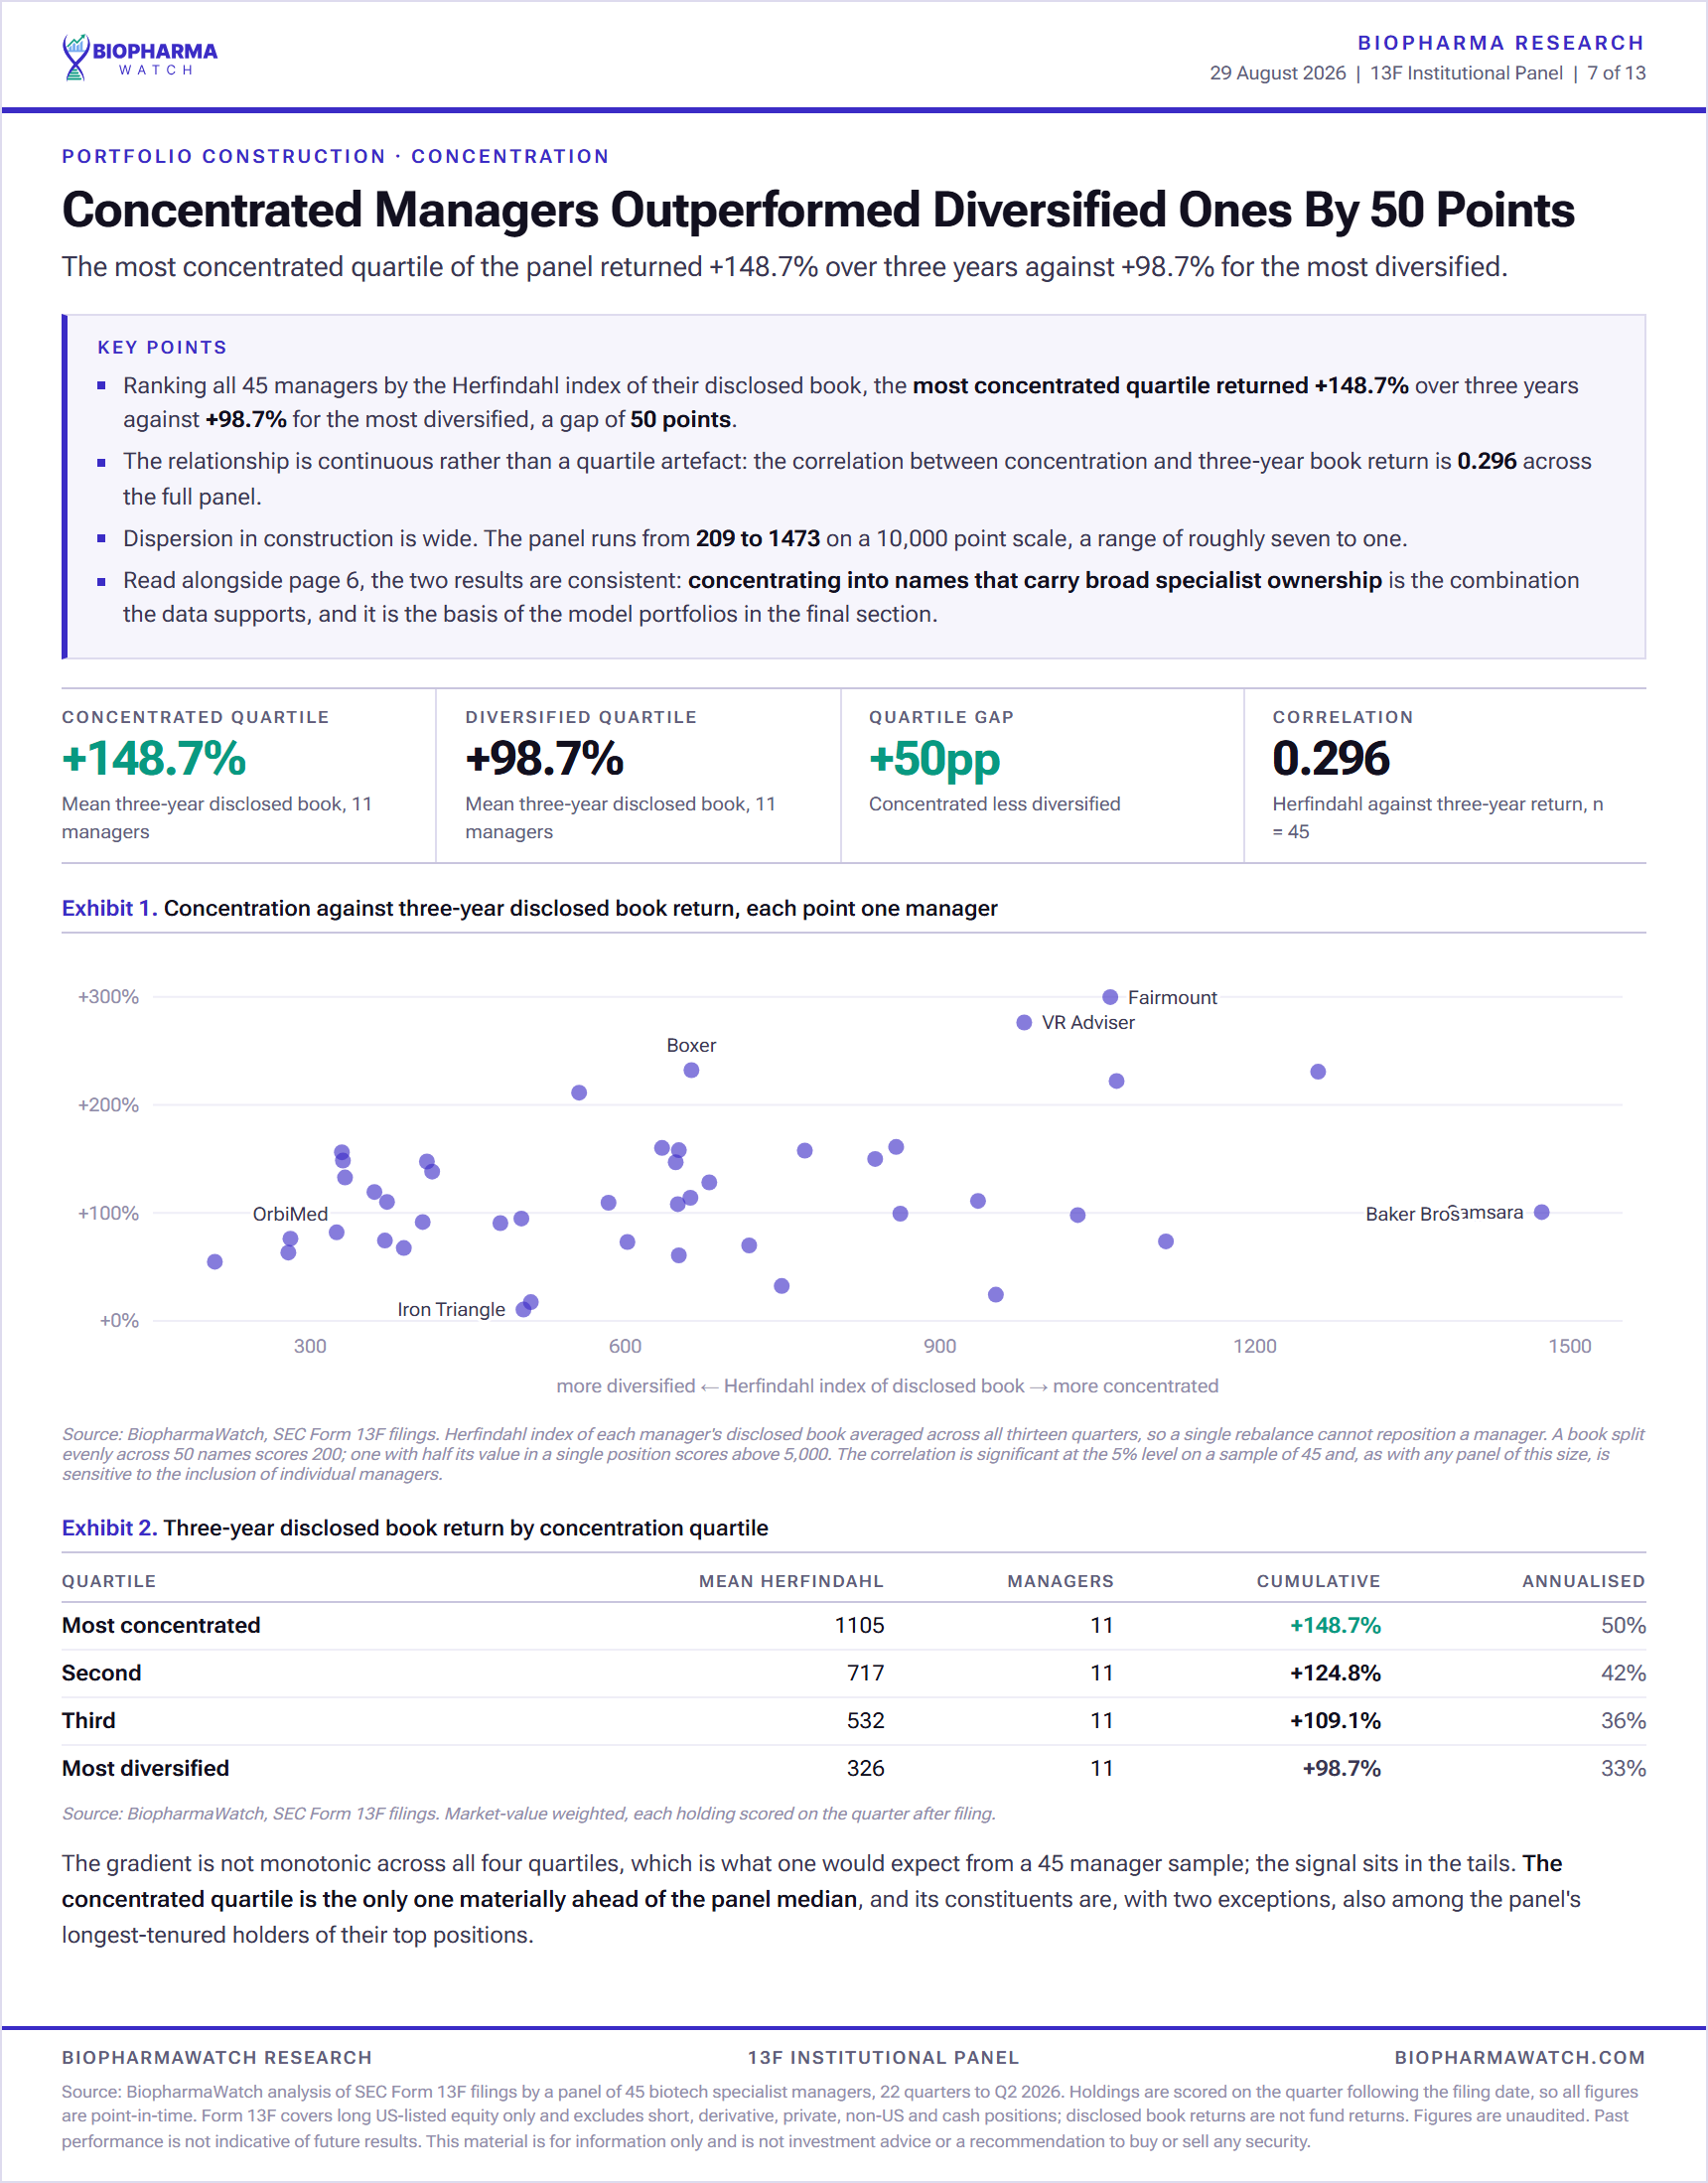
The relationship is real but fragile, and the fragility is the point. Across the 45 funds, portfolio concentration correlates with three-year disclosed book return at r = 0.296, t = 2.03 against a 5% threshold of 2.017. It clears by 0.013.
Drop any single fund and re-run it, and 25 of the 45 leave-one-out versions fall below the bar, with t ranging from 1.58 to 2.36. A result that survives on the identity of one manager is a result to hold loosely. The tightest quartile of managers by concentration averaged 148.7% over three years on their disclosed books against 98.7% for the loosest quartile, a 50 point gap across 11 funds a side.
Every return figure in this section describes a disclosed US long book, not a fund. 13F shows long US-listed equity only: no shorts, no private positions, no non-US listings, no cash. Much of this roster runs crossover money whose private portfolio is larger than the filed one, so these numbers are not fund performance and should never be read as it.
What did biotech hedge funds rotate into over three years?
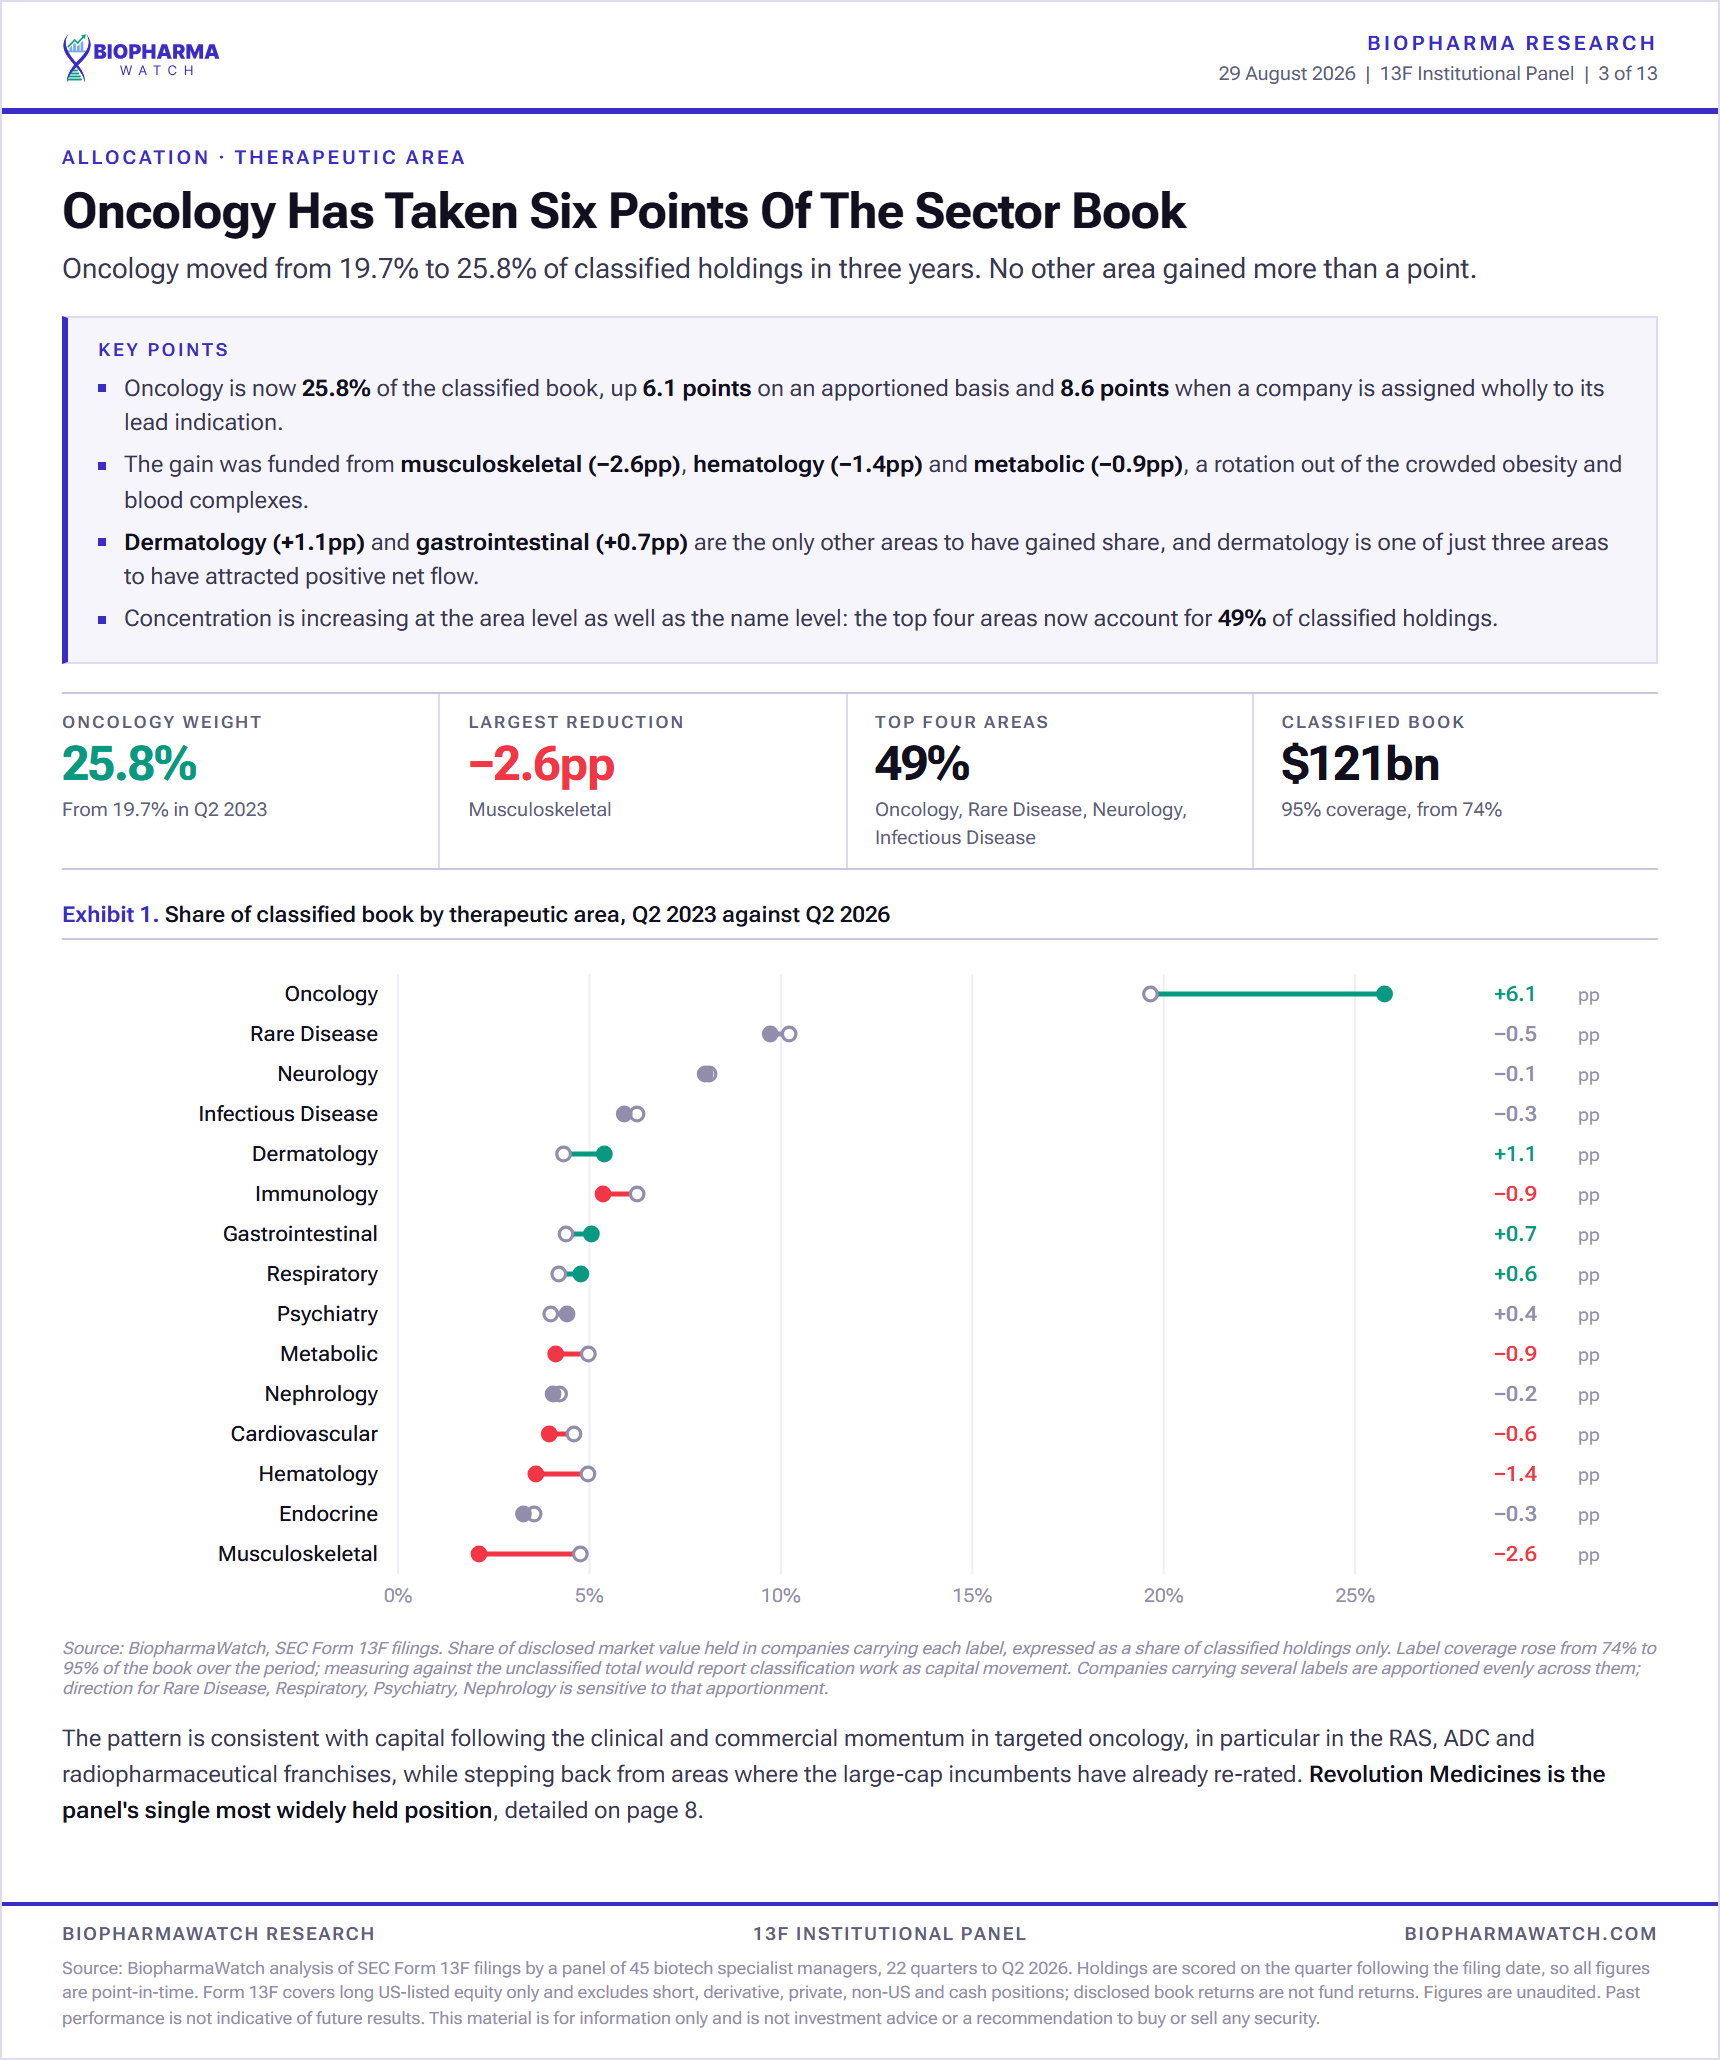
Oncology, by a wide margin. It went from 11.8% of the classified book in Q2 2023 to 20.4% in Q2 2026, a shift of +8.6 points. Hematology, musculoskeletal and cardiovascular funded it. Every share below is computed on classified names only, for a reason worth stating.
Therapeutic area
Q2 2023 share
Q2 2026 share
Shift
Oncology
11.8%
20.4%
+8.6pp
Hematology
10.2%
6.2%
-4.0pp
Dermatology
15.5%
18.6%
+3.1pp
Musculoskeletal
4.9%
2.4%
-2.6pp
Cardiovascular
20.1%
17.8%
-2.3pp
Metabolic
3.5%
1.5%
-2.0pp
Endocrine
7.8%
6.2%
-1.7pp
Rare Disease
0.5%
1.8%
+1.3pp
Label coverage improved sharply over the window, from 73.8% of the book classified in Q2 2023 to 94.8% in Q2 2026. Computing share of the total book would therefore report label backfill as if it were money moving, and it flips two signs. Renormalising to the classified book, $64.5B then and $120.7B now, is the only way to read this honestly.
One row above is fragile. Rare Disease changes sign depending on whether a company working across several areas is assigned to its primary area or split fractionally across all of them, so treat it as unresolved rather than as a move. Every other row above holds its sign under both rules. A further 5 areas disagree between the two rules but each moves less than a point and none reach the table above.
Why did biologics lose eleven points of the biotech hedge fund book?
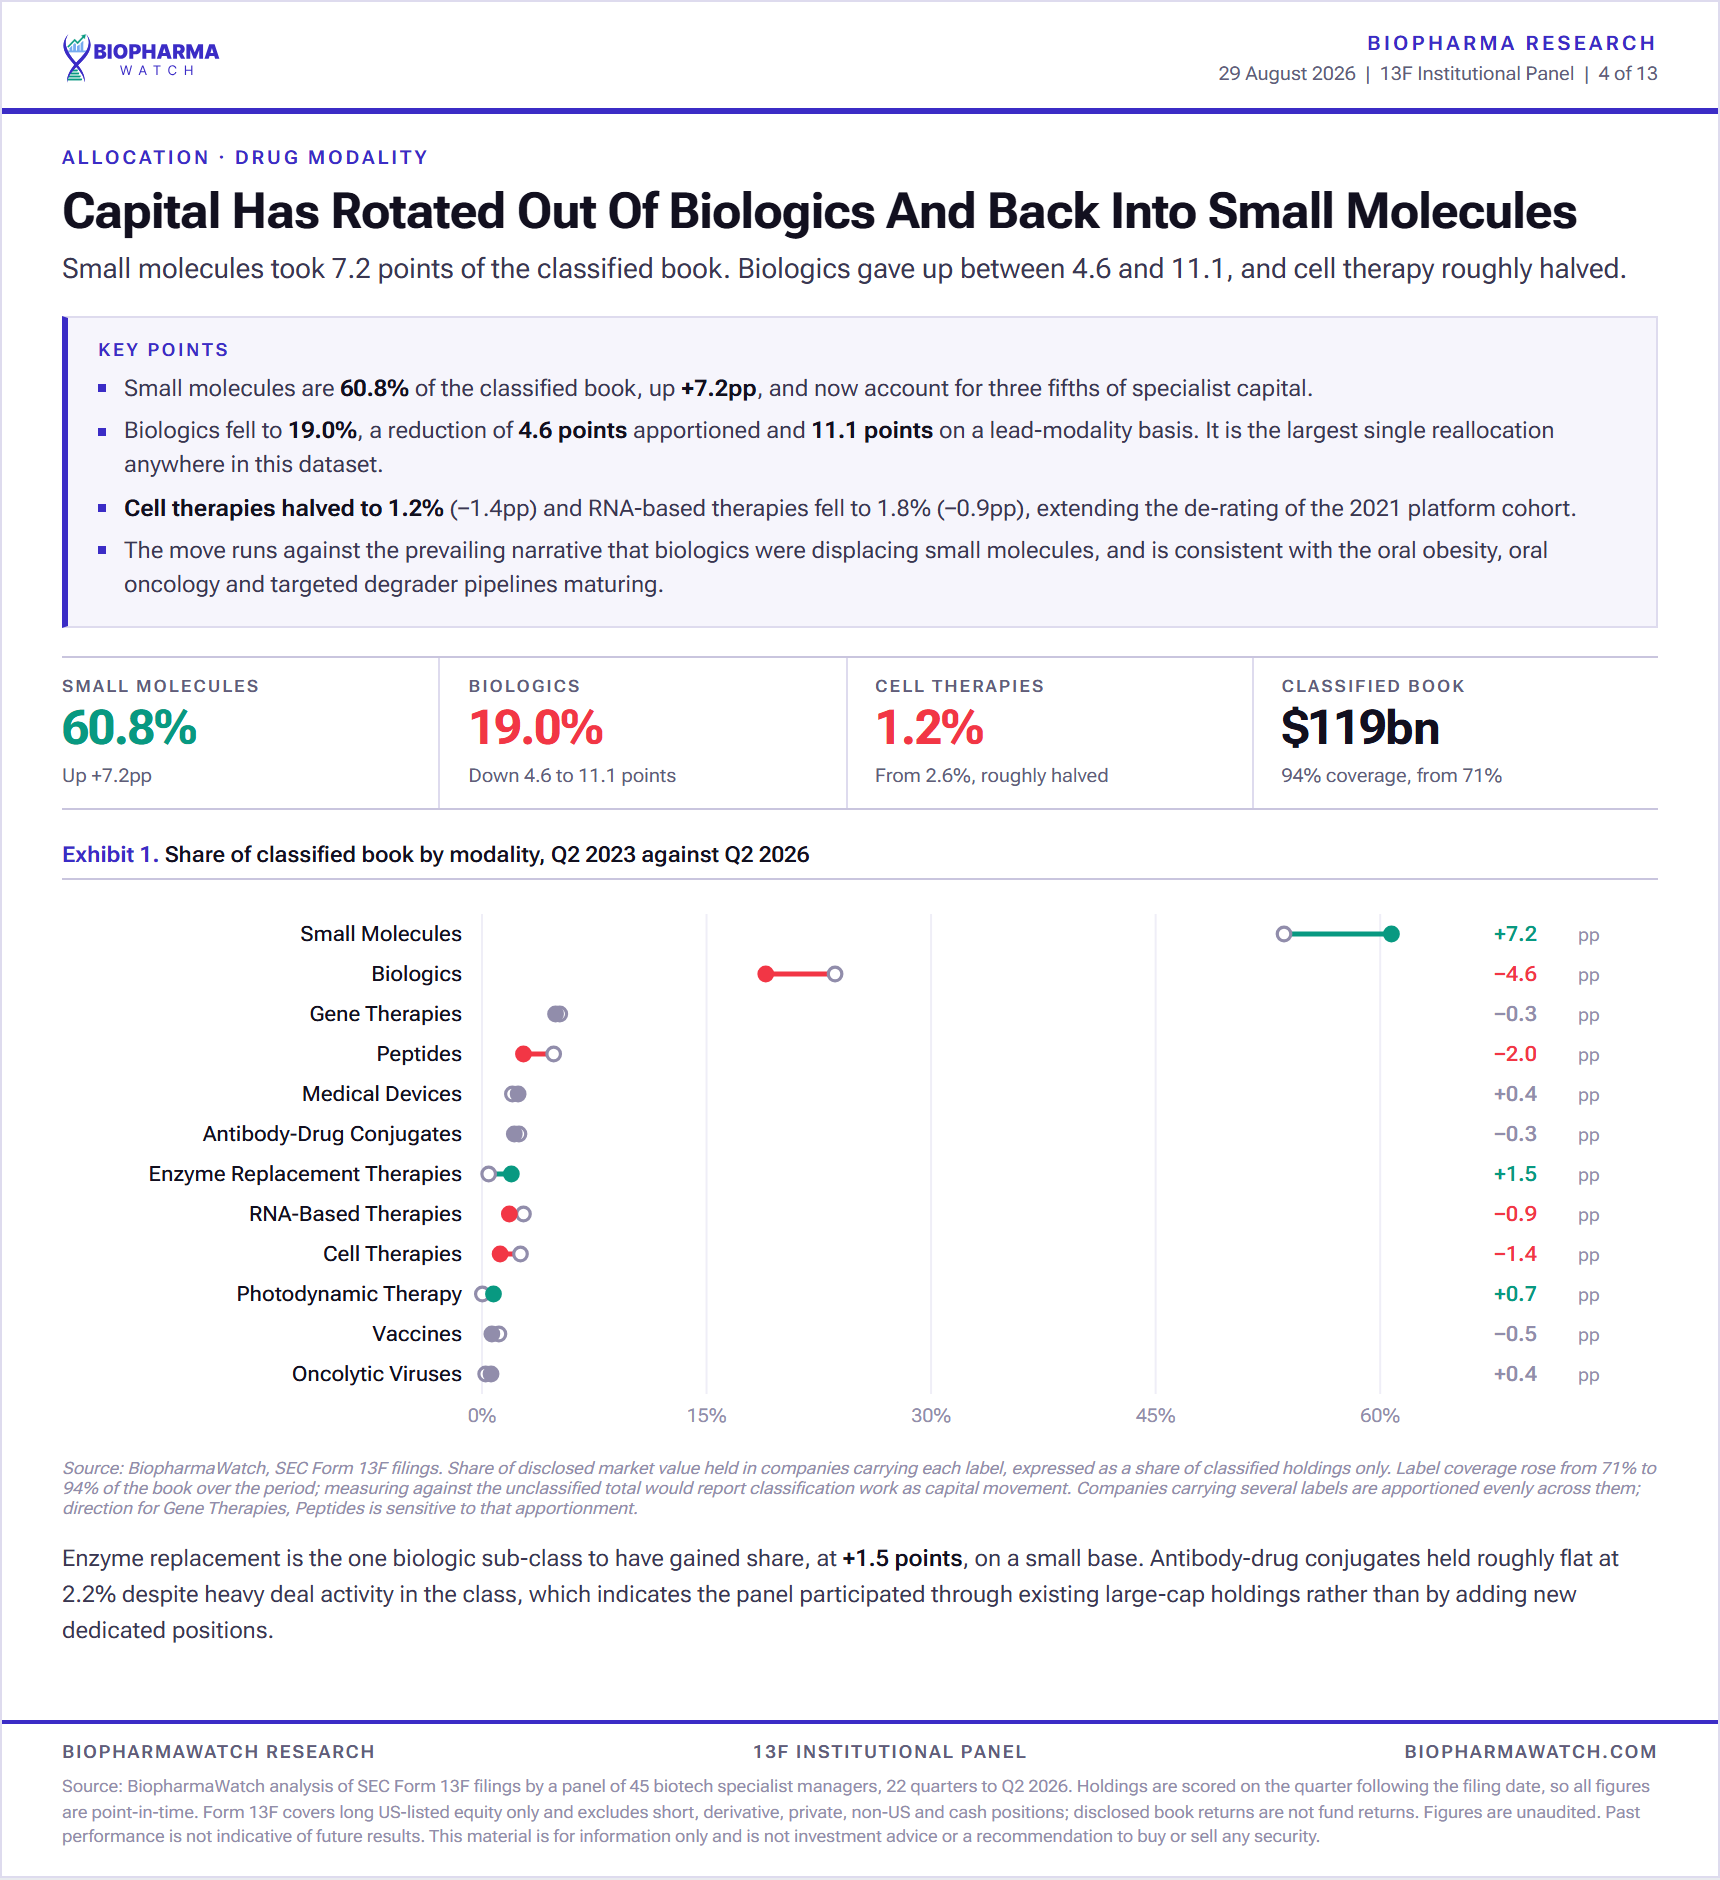
Biologics fell from 49.9% of the classified book to 39.2%, a 10.7 point fall and the largest single shift in the dataset. Small molecules absorbed +4.8 points of it and gene therapies +2.1 points.
Drug type
Q2 2023 share
Q2 2026 share
Shift
Biologics
49.9%
39.2%
-10.7pp
Small Molecules
29.9%
34.7%
+4.8pp
Gene Therapies
3.5%
5.6%
+2.1pp
Enzyme Replacement Therapies (ERT)
0.4%
2.0%
+1.6pp
Peptides
3.7%
5.2%
+1.5pp
Photodynamic Therapy (PDT)
0.0%
1.5%
+1.4pp
Antibody-Drug Conjugates (ADCs)
6.9%
6.3%
-0.6pp
Read this as a change in the mix of what specialists own, not as a verdict on the science. Modality labels sit on the company, so a company running both an antibody and an oral programme carries one label, and the shift partly reflects which companies the panel exited rather than which molecules it prefers. The direction is consistent across three years and both labelling rules, which is why it is here at all.
Which biotech stocks did hedge funds just buy and just sell?
AVTX drew the most new entries in Q2 2026 at 8 funds opening a position, while Centessa Pharmaceuticals saw the largest exodus, with 16 funds closing out entirely. New positions and full exits are the cleanest read on intent in a 13F, because neither is a price artifact.
The turnover behind those lists is steady rather than dramatic. In a typical quarter the panel opens around 457 positions and closes around 476, against roughly 1,912 positions held unchanged. The book turns over at the edges while the core sits still.
Subscribers see the full quarterly entry and exit list for all 520 companies, with per-fund detail and the filing date each position became public. Compare plans.
How concentrated is biotech hedge fund ownership?
Extremely, at the tail. Of the 520 companies the panel holds, 145 are held by exactly one fund and only 90 are held by eight or more. The median company has 3 holders. Consensus in biotech 13F data is a thin layer on top of a very long tail of single-manager positions.
That distribution is why the crowding test is hard to pass. The high-ownership bucket contains fewer than a hundred names in any given quarter, so a single large move in one of them swings the quarterly average, and twelve quarters of noisy averages is not enough to separate a real effect from chance. More data will settle it. Twelve quarters has not.
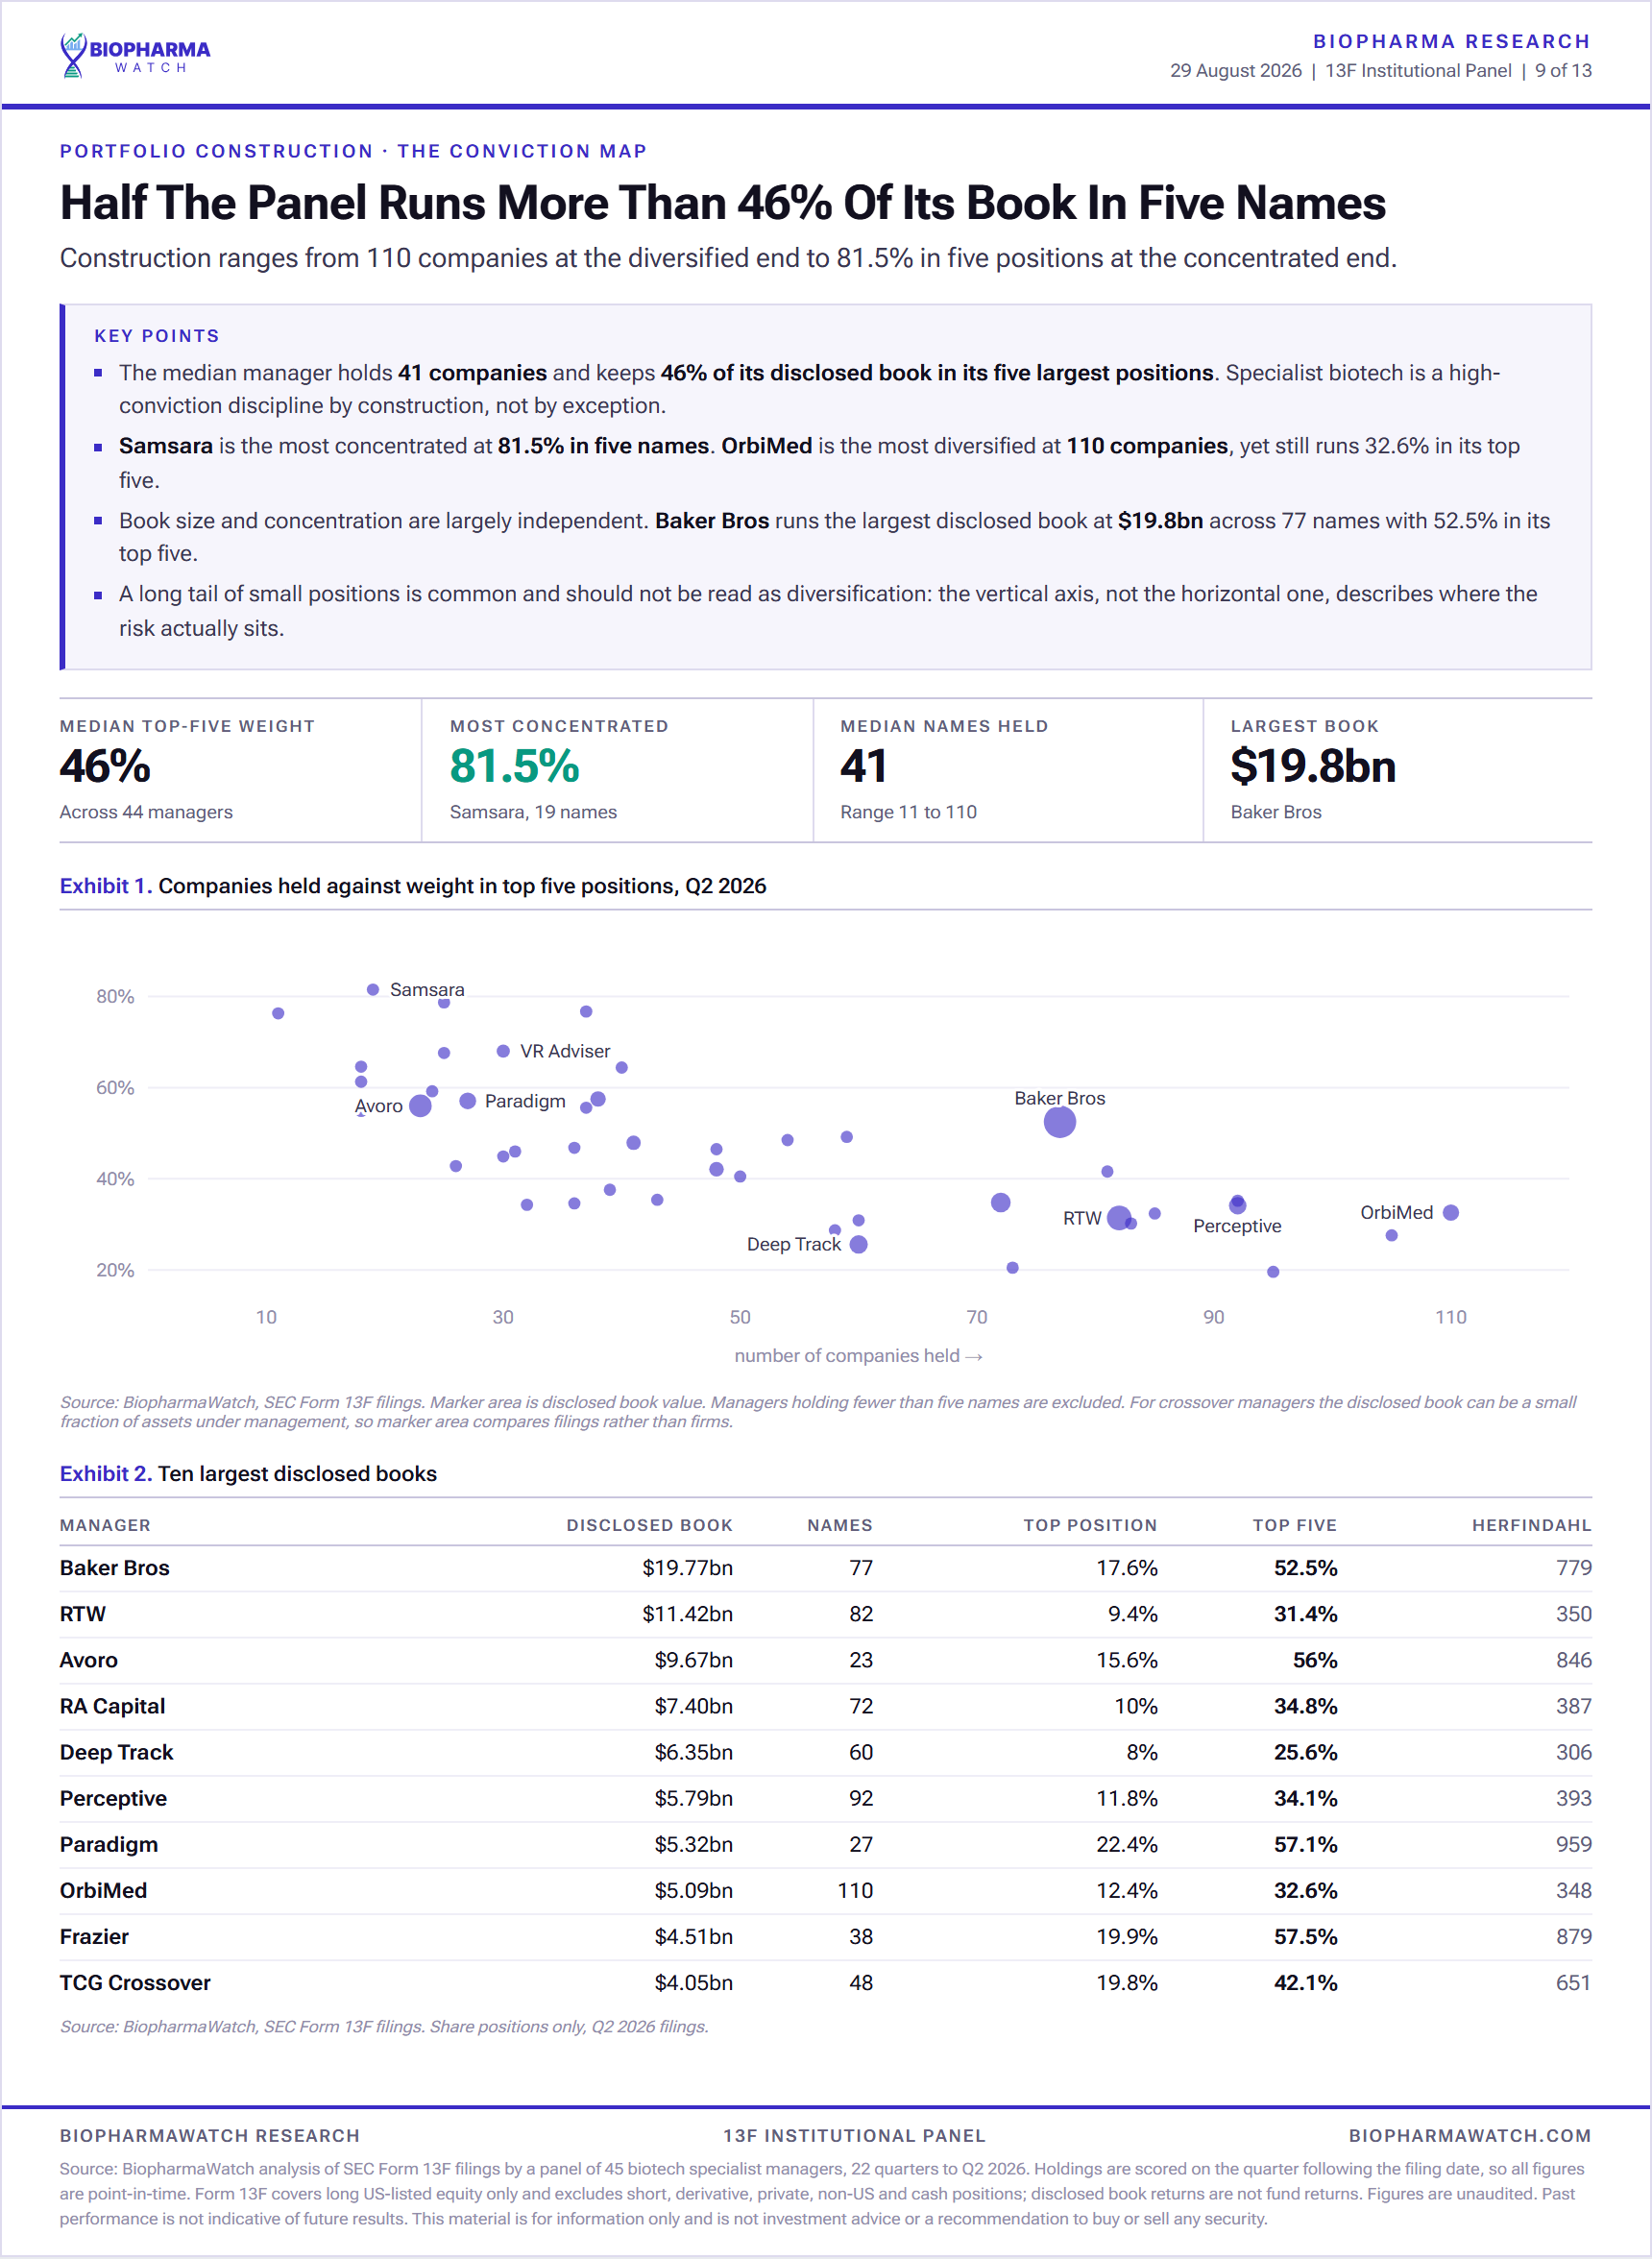
At the fund level the same shape appears. Baker Bros. Advisors discloses $19.8B across 77 names with 53% in its top five, while Avoro Capital Advisors holds $9.7B across just 23 names. Both are described as biotech specialists and they are running very different books.
What does 13F data not tell you about a hedge fund?
Most of the portfolio, in many cases. A 13F discloses long US-listed equity positions only. It excludes short positions, private and pre-IPO holdings, non-US listings, cash, debt, options economics beyond the notional line, and anything held through a swap. For a crossover fund the filed book can be the smaller half.
Three further limits apply to everything above. Filings arrive 45 days after quarter end, so the panel's Q2 2026 book describes 30 June positions read in mid August. The panel is 45 funds we classify as biotech specialists, not every fund that owns biotech. And 76 of the 520 names, $8.9B of the book, carry a data-quality flag: a foreign symbol form, a missing therapeutic label, or no match in our company reference. Names flagged as non-drug-developers, including a managed care holding several funds opened this quarter, are excluded from the tables above rather than quietly counted as biotech.
None of this makes the data useless. It makes it a record of disclosed positioning, which is exactly what it is good for, and not a performance record, which it can never be.
How should you use 13F data in biotech investing?
As a screen-out and a starting point, not a buy list. The one statistically supported finding in this dataset is that thinly-held names lag, so ownership breadth is most useful for flagging what to examine harder. Everything else here is descriptive: where money sits, where it moved, and what changed hands.
Three practical uses hold up. Use full exits and new openings rather than dollar value, because value moves with price and position count moves with intent. Read the rotation tables as a map of where specialist attention has gone, with +8.6 points into oncology and -10.7 points out of biologics as the two structural moves of the last three years. And treat the 145 single-holder names as an idea list to research, not a signal, since that bucket contains both genuine early conviction and positions nobody else wants.
BiopharmaWatch tracks all 45 biotech specialist funds every quarter, with per-fund holdings, quarter-on-quarter changes and the underlying filings. See what is included.
Where does this hedge fund data come from?
SEC Form 13F filings, parsed and normalised into 22 quarters covering Q1 2021 to Q2 2026 for 45 biotech-dedicated managers, 9,296 distinct positions in total. Share rows only: 13F splits shares, calls and puts into separate lines, and counting them together double counts any fund holding both.
Returns are measured filing wall to filing wall. A position disclosed for quarter Q earns its stock's return over quarter Q+1, so the measurement window opens only after the position was public knowledge, and nothing here uses information before it was available. Fund-quarters with fewer than three priced positions are dropped, and moves beyond 500% are rejected as data artifacts. Price coverage across the panel runs 91% to 99%.
Significance is computed across quarters rather than across holdings, which is the conservative choice and the reason several appealing results in this post are reported as failures. Therapeutic area and drug type shares are renormalised to classified names only, and both labelling rules are run to check that a reported shift does not depend on the rule chosen.
What biotech stocks are hedge funds buying in Q2 2026?›
Across Q2 2026 13F filings from 44 biotech specialist funds, the most widely held names are Revolution Medicines (RVMD, 19 funds), Cogent Biosciences (COGT, 19) and Dianthus Therapeutics (DNTH, 18). 27 companies are held by 12 or more funds. The largest new entries this quarter were Avalo Therapeutics (AVTX, 8 funds opening), Editas Medicine (EDIT, 8 funds opening), Aura Biosciences (AURA, 7 funds opening).
What is the most owned biotech stock by hedge funds?›
Revolution Medicines (RVMD) is the most widely held biotech among specialist funds, owned by 19 of the 44 funds in the BiopharmaWatch panel as of the Q2 2026 filings, with a combined disclosed position of $5.8B. For context on how unusual that is, the median company in the panel's book is held by 3 funds and 145 of the 520 companies are held by exactly one.
Does copying hedge fund 13F filings actually work in biotech?›
Not on the evidence we can measure. Sorting every 13F name by how many specialist funds hold it produces a clean staircase, and names held by 12 or more ran +5.26 points a quarter above the universe, but that result tests at t = 1.31 across 12 quarters and does not clear the 5% bar. The consensus-minus-orphans spread fails too, at t = 1.44. We report the figures and the failed tests rather than the figures alone.
What does it mean when very few hedge funds own a biotech stock?›
It is the one measurable warning sign in this dataset. Names held by exactly two of the 45 specialist funds lag the average 13F-held biotech by 2.02 percentage points per quarter at t = -2.35, which clears the 5% significance bar. Thin specialist ownership is a measurably bad sign, while heavy specialist ownership is only a promising one. That asymmetry makes 13F data more useful as a screen-out than a buy list.
Do concentrated biotech hedge funds do better than diversified ones?›
The relationship is real but fragile. Across 45 funds, concentration correlates with three-year disclosed book return at r = 0.296, t = 2.03 against a threshold of 2.017, so it clears by 0.013. Drop any single fund and re-run it and 25 of 45 versions fall below the bar. The tightest quartile averaged 148.7% on their disclosed books against 98.7% for the loosest.
What is a 13F filing and how current is the data?›
Form 13F is a quarterly SEC filing in which institutional managers with over $100 million disclose their US-listed equity holdings as of quarter end. Filings are due up to 45 days after the quarter closes, so Q2 2026 positions, held as of June 30, became public in mid August. A 13F shows long US-listed stock positions only: no short positions, no private or pre-IPO holdings, no non-US listings and no cash.
Do 13F figures show how a hedge fund actually performed?›
No, and they should never be read that way. Every figure in this analysis describes a disclosed US long book, not a fund. Shorts, private positions, non-US listings, cash and swap exposure are all invisible in a 13F, and much of this roster runs crossover money whose private portfolio is larger than the filed one. A disclosed book return is a measurement of publicly known positioning, not a record of what any manager earned.
Which hedge funds does BiopharmaWatch track?›
The panel covers 45 funds specialising in biotech and life sciences, including Baker Bros. Advisors, RTW Investments, Avoro Capital Advisors, RA Capital Management, Deep Track Capital, Perceptive Advisors and others. Every position from every filing since Q1 2021 is tracked, 9,296 distinct positions in total, using share rows only so that a fund holding both stock and options is not counted twice.
Is the consensus list investment advice?›
No. This is a measurement of institutional positioning, published for information only. Holder counts describe what 45 specialist funds disclosed as of the latest filings, which are already at least 45 days old when they become public. Where a pattern in this data fails its statistical test, that is stated. Nothing here forecasts any stock's future return.